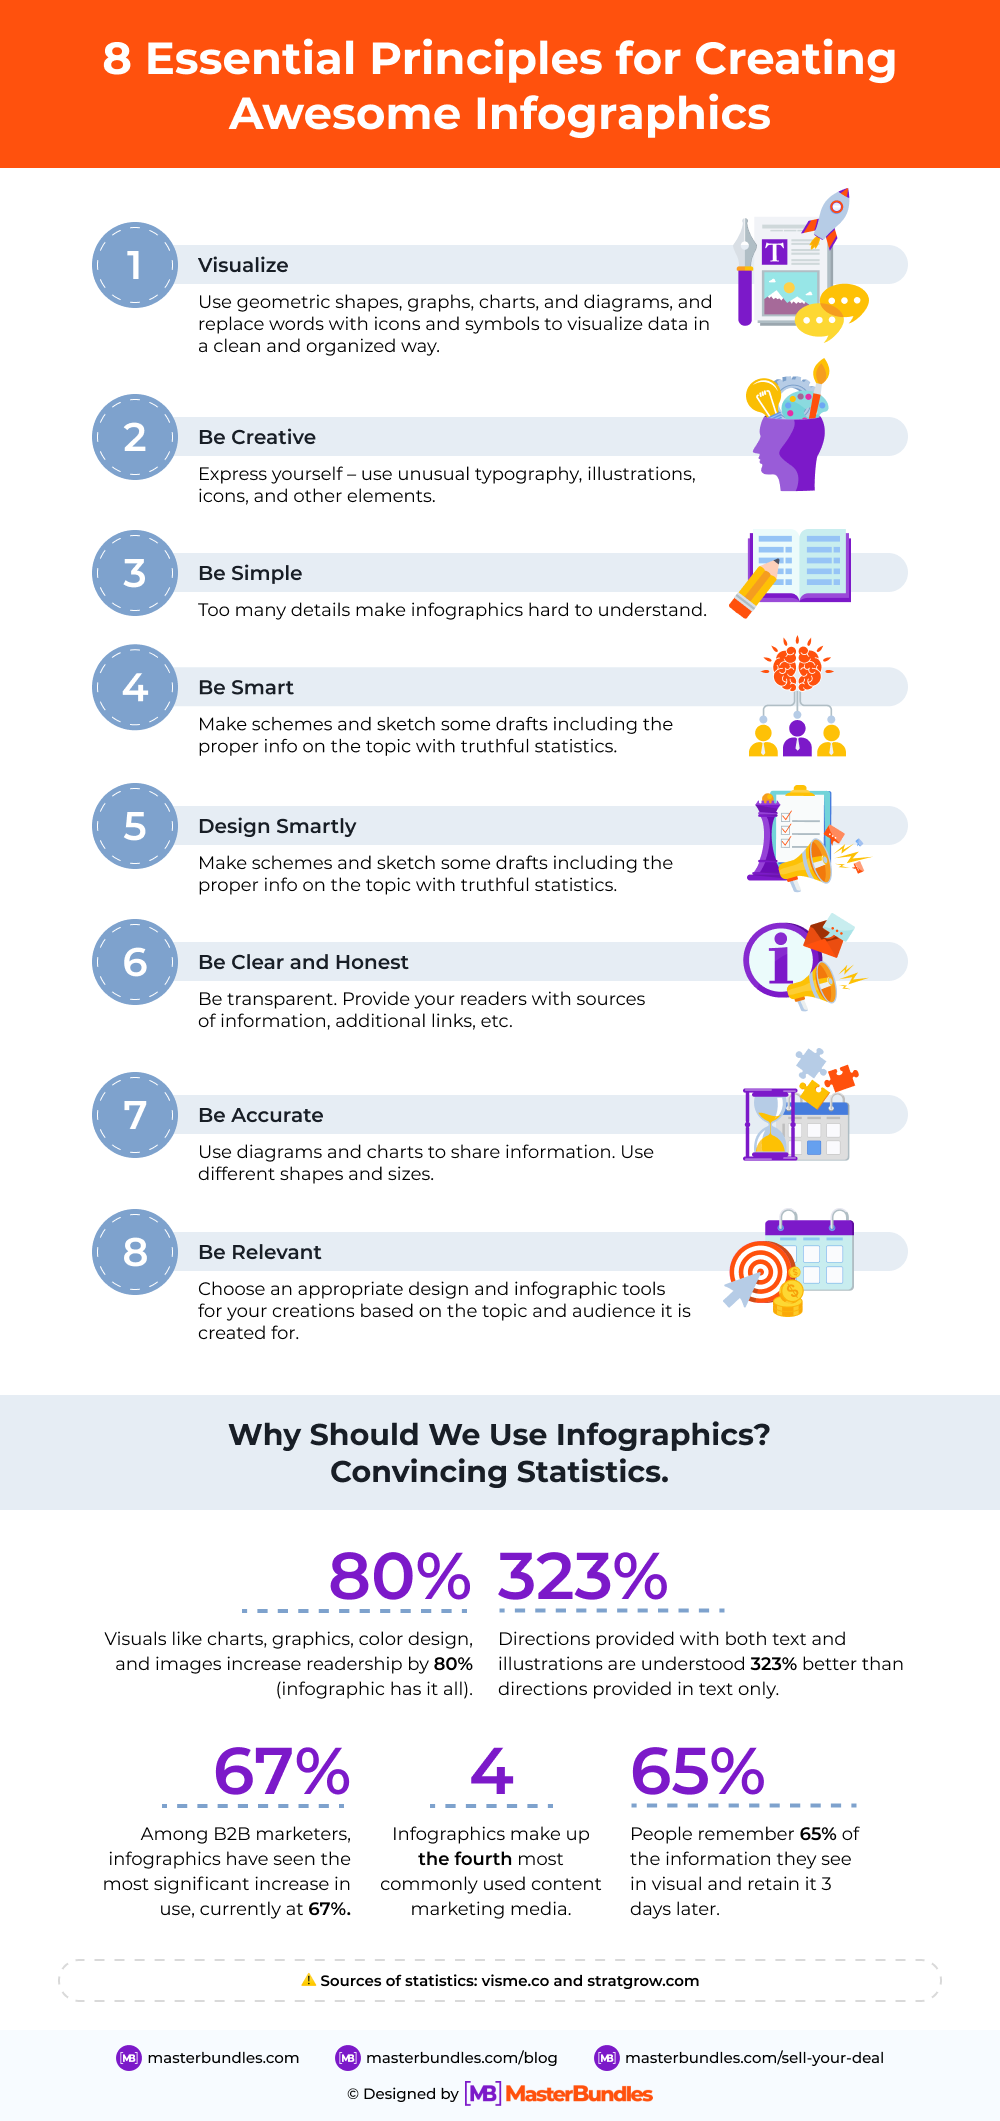
How to Create an Infographic in 8 Simple Steps
Whether you are an experienced designer or a creative newbie who has only begun making some outstanding designs, you need to take a minute to recognize the trend and create some unique art that follows the best design principles. In this article, we have collected some hot design topics that you should follow in order to master your talents in the right direction, create up-to-date infographic templates, and as a result, be a high-demand graphic specialist.

Let’s begin discussing these principles now.

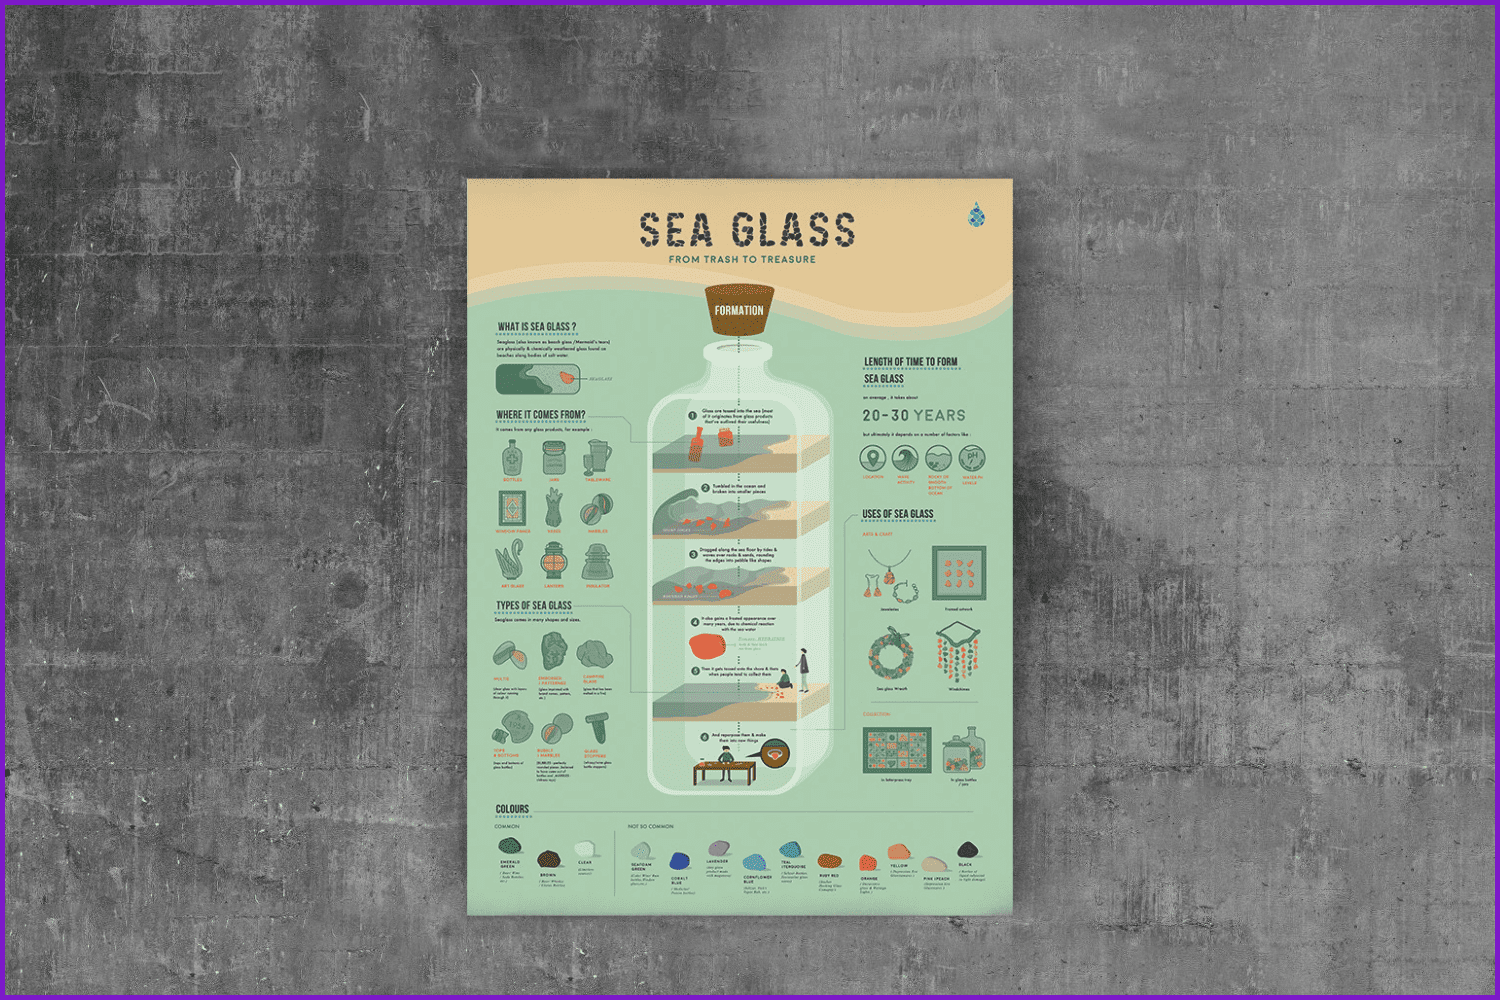
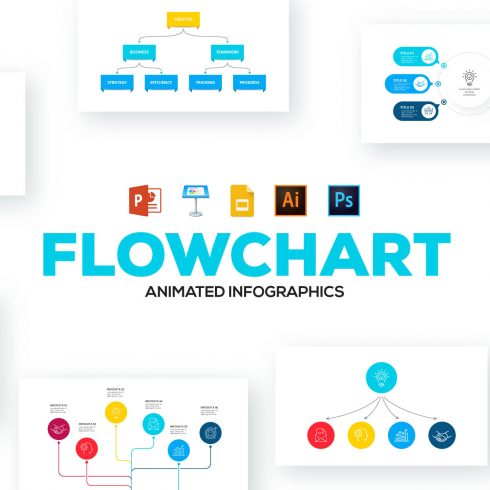
Infographic made by MasterBundles
Visualize
You don’t want your infographic to consist of just text, do you? Ordinary data is boring and sometimes difficult to understand. Using geometric shapes, graphs, charts, and diagrams can all help you visualize data in a clean and organized way. If possible, replace words with icons and symbols. Remember that people today are much more receptive to graphic information than they are to plain text.

Be Creative
Creativity first! Yep, at least almost always. To be remarkable and successful you should make some significant efforts to create the best, most unique design possible. Yes, it could take some time before you find your own style, but creativity is the thing that makes a simple chart into an amazing infographic. The simple infographic is boring. Express yourself. Do not neglect using unusual typography, illustrations, icons, and other elements.
Make your infographic stand out!
Be Simple
Well, creativity is a good start, but be sure that your designs are not overwhelming. Too many details make infographics hard to understand. Knowing your target audience is also very helpful in the process of making infographic designs. And sure, don’t forget to search for some great infographic examples to see how your designs stand up to the competition.
Be Smart
Actually, this is a power that helps to create well-organized and accurate infographics. Making infographics requires a bit of study about the topic before the designing process. Try to make schemes and sketch some drafts including the proper info on the topic. Use Google, or find some materials in the library, read books and magazines, and look for truthful statistics.
Best Related Products

Design Smartly
There is room for creativity in creating infographics, so there are no exact design guidelines, of course. But here are a few tips:
- Infographics on a colored background attract more attention than on a white one.
- The use of colors corresponding to the corporate colors is encouraged.
- When choosing a communication channel to display infographics, make sure that its format meets the requirements of the “site” (vertical or horizontal layout, font size, whether or not it is possible to scroll/enlarge the picture, etc.).
- All images and icons are perceived as information, so they must be carefully selected and aligned with the meaning.
Best Related Articles


Be Clear and Honest
Give readers the opportunity to find additional information. Provide them with additional links and so on. Share your sources (no matter how “top secret” they may be). Don’t be afraid to be transparent, especially nowadays when the world is in need of honesty and clear data. Keep telling and sharing the truth.
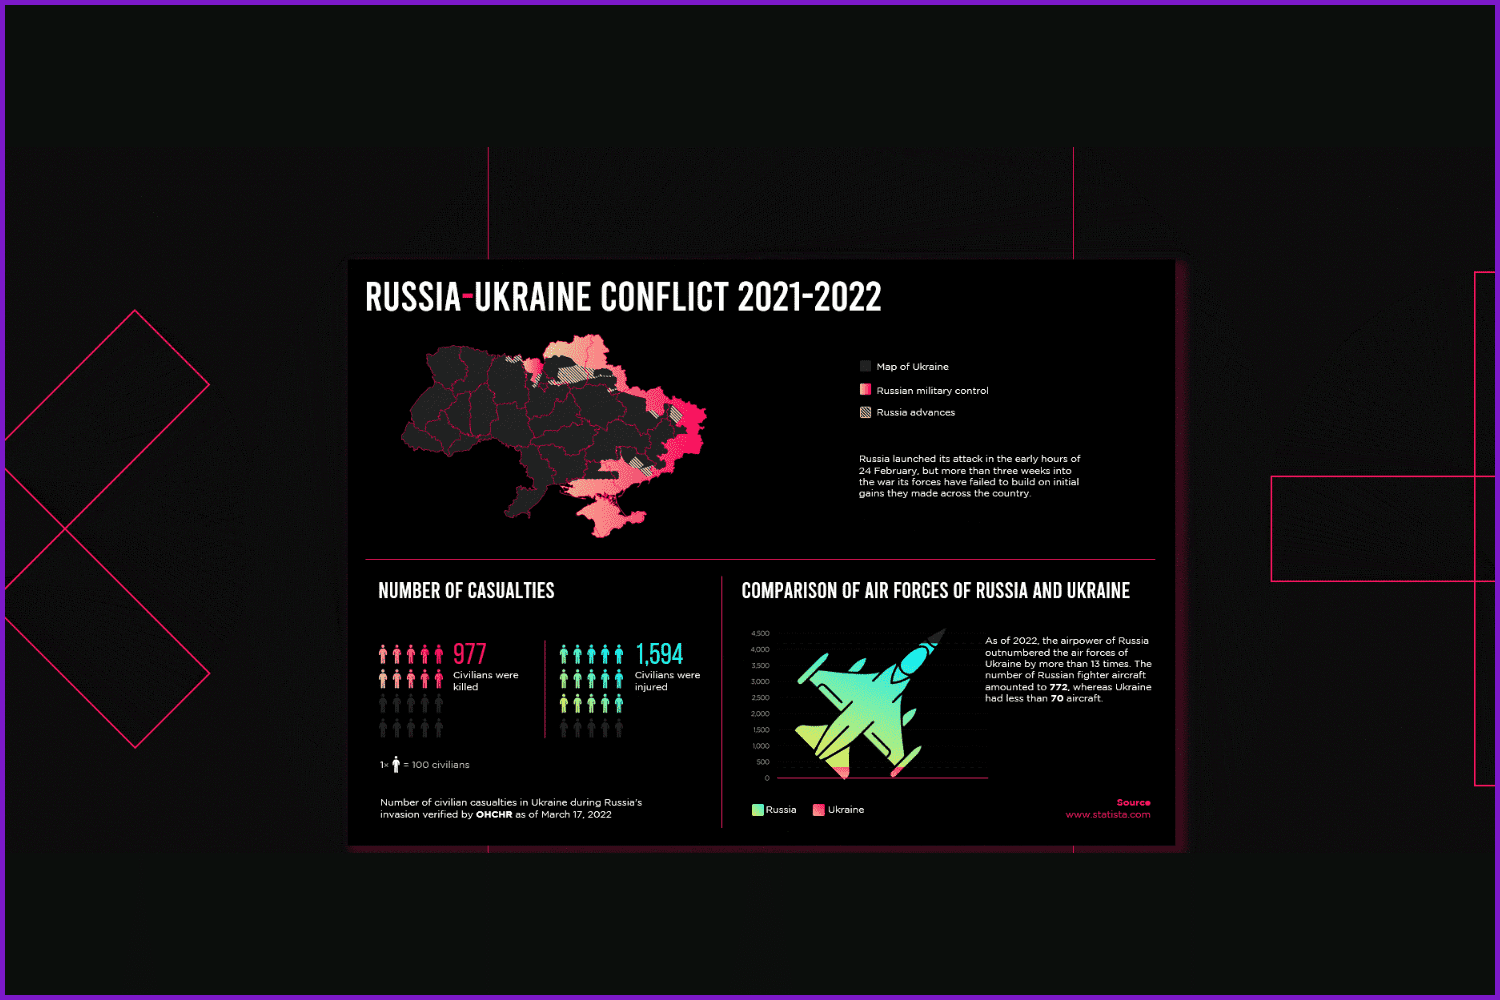
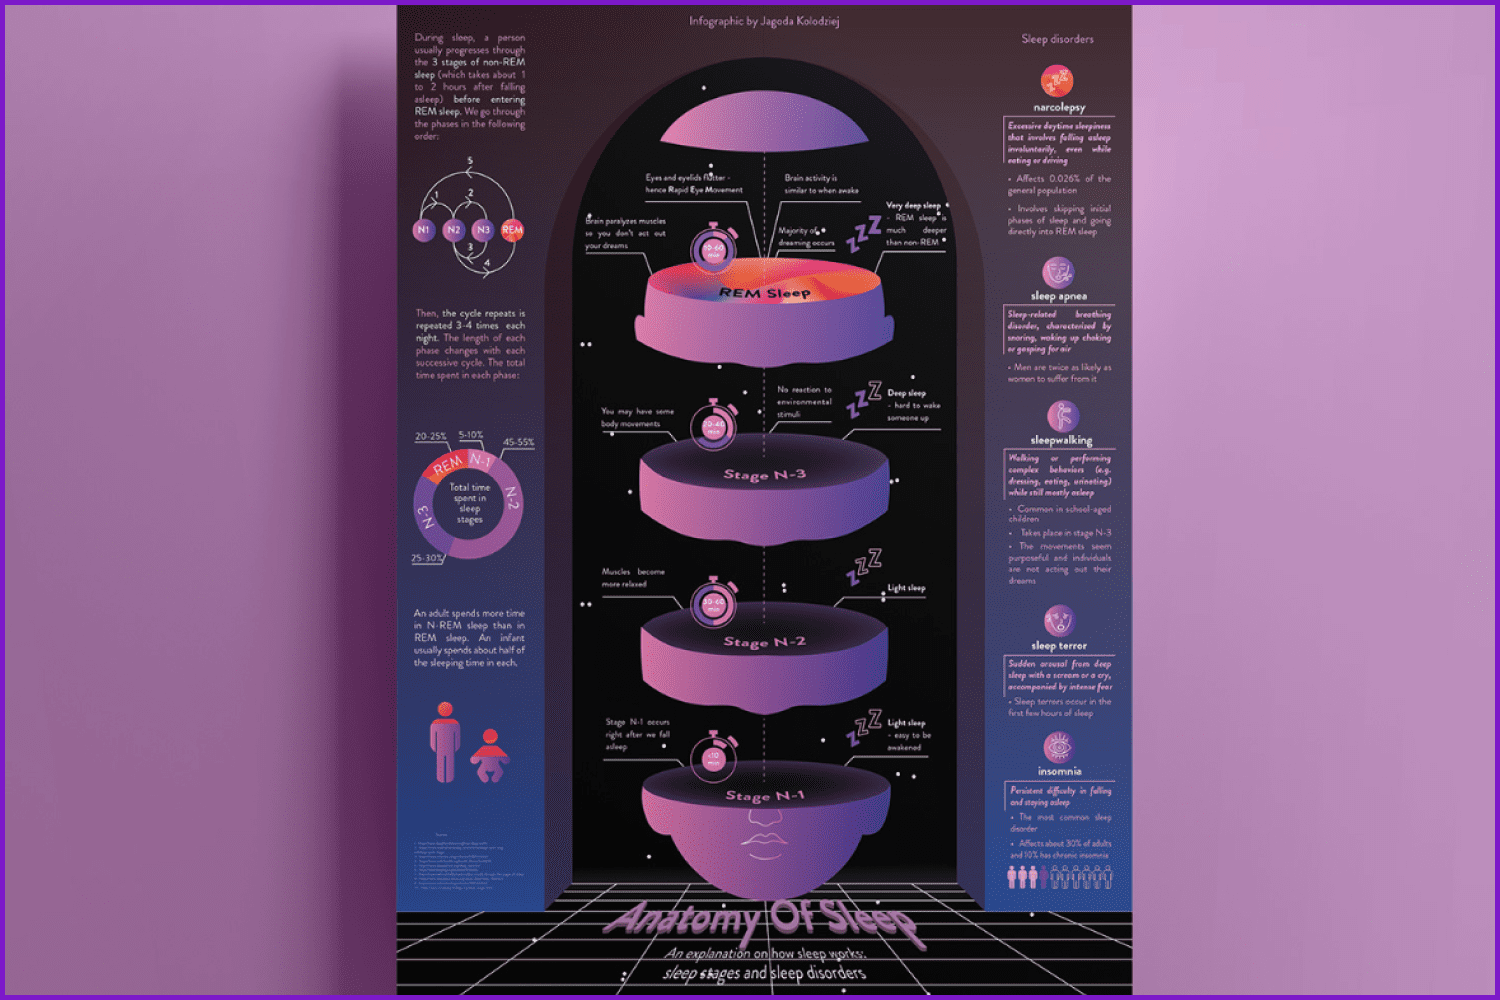
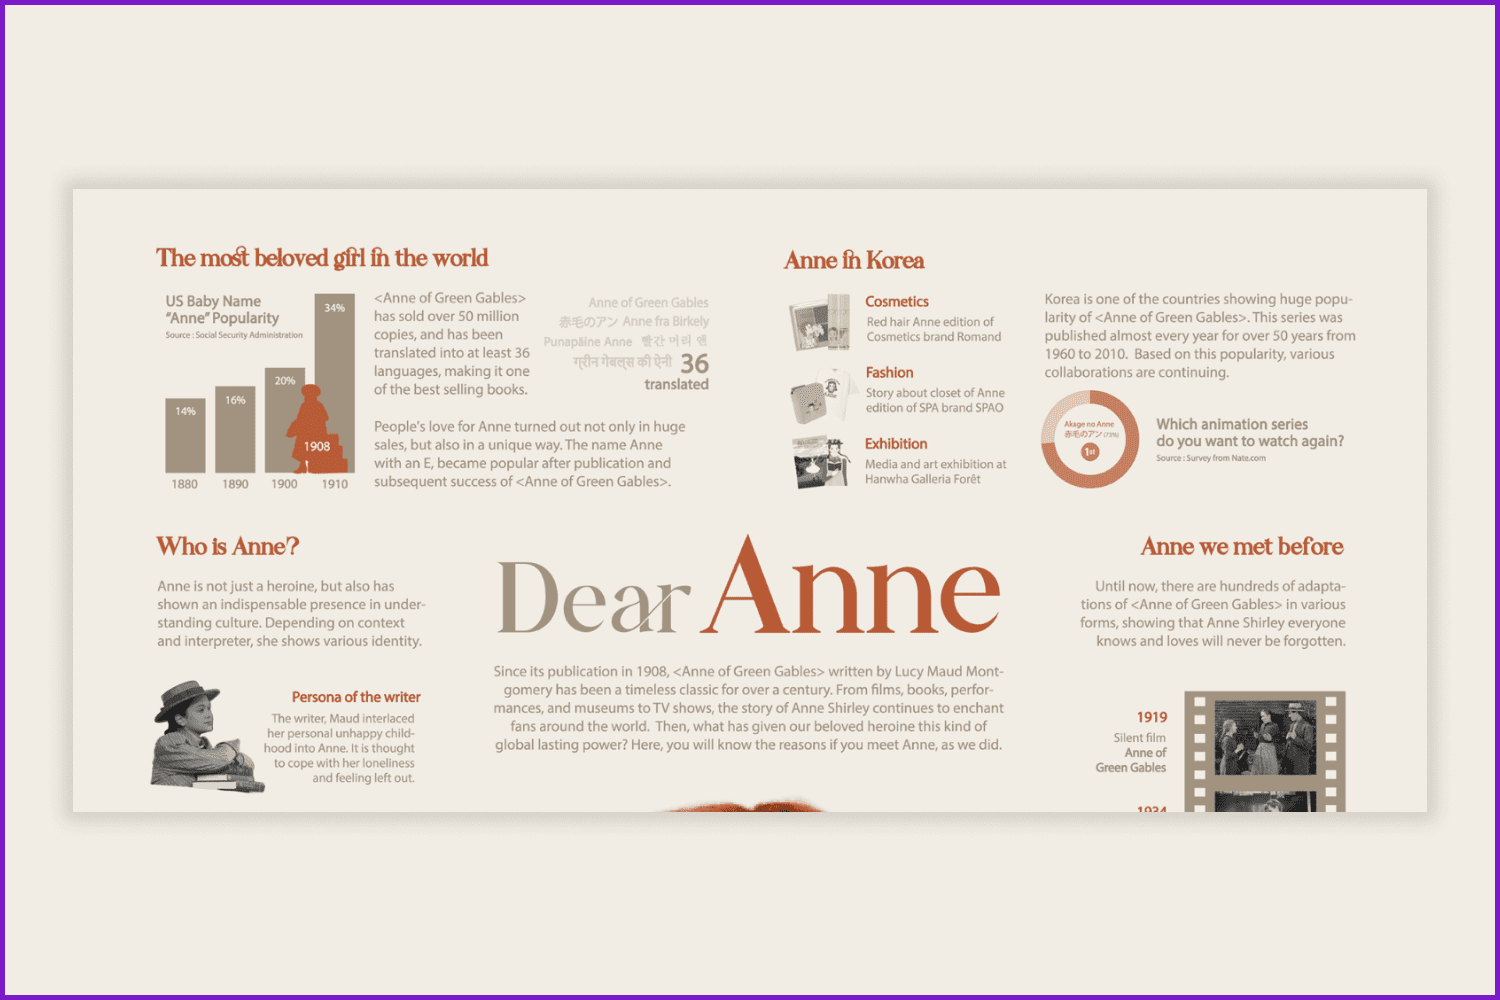
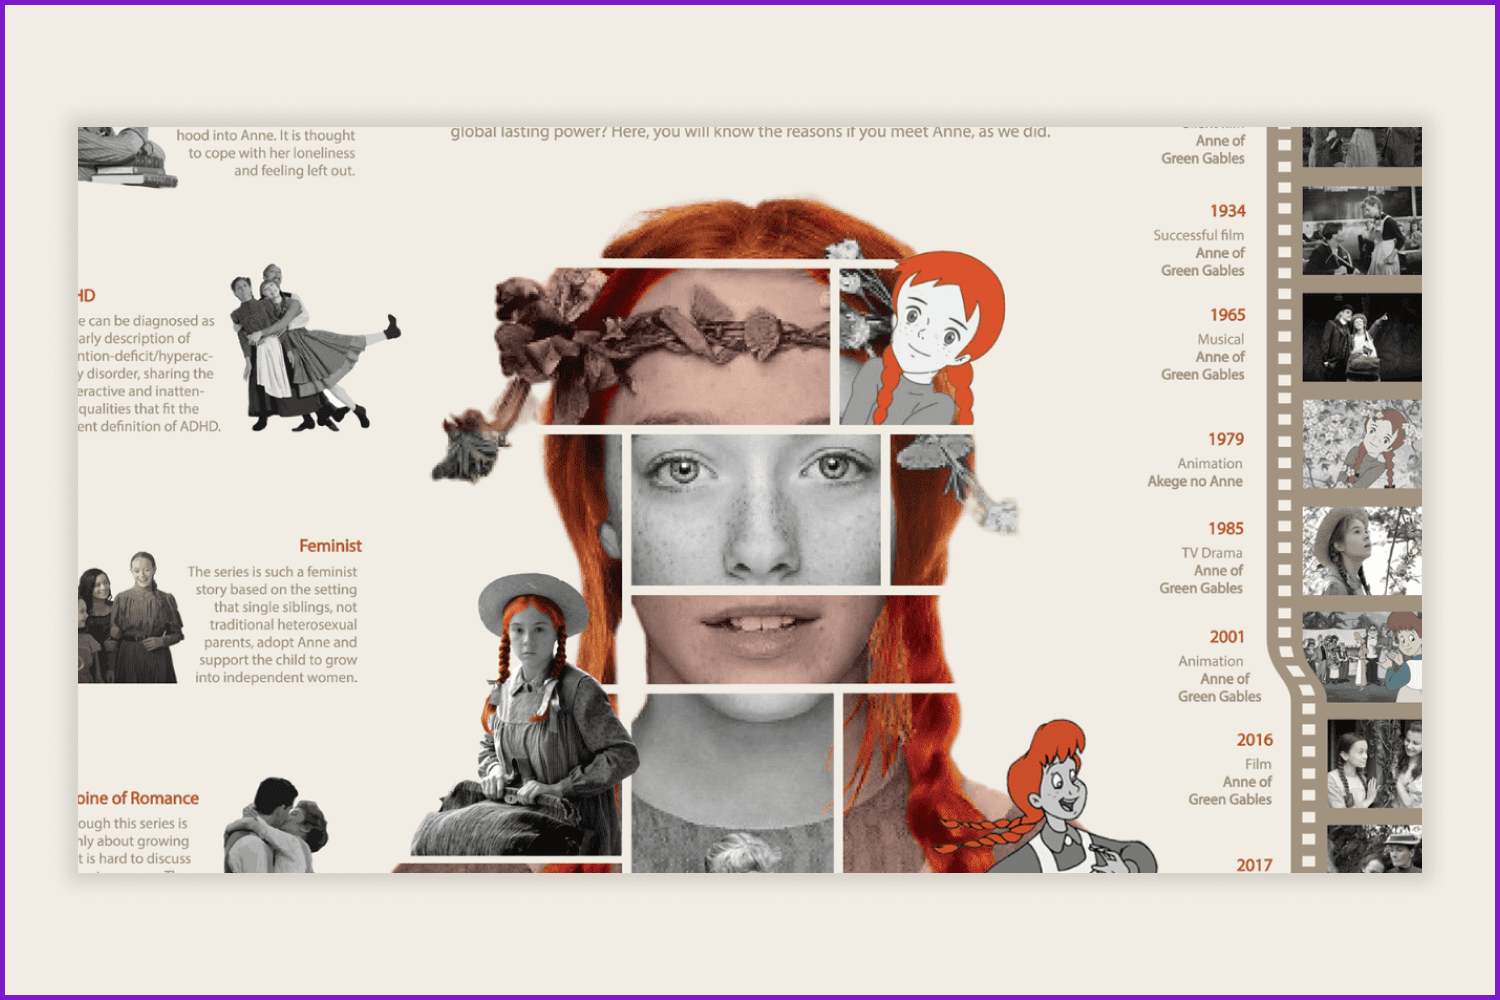
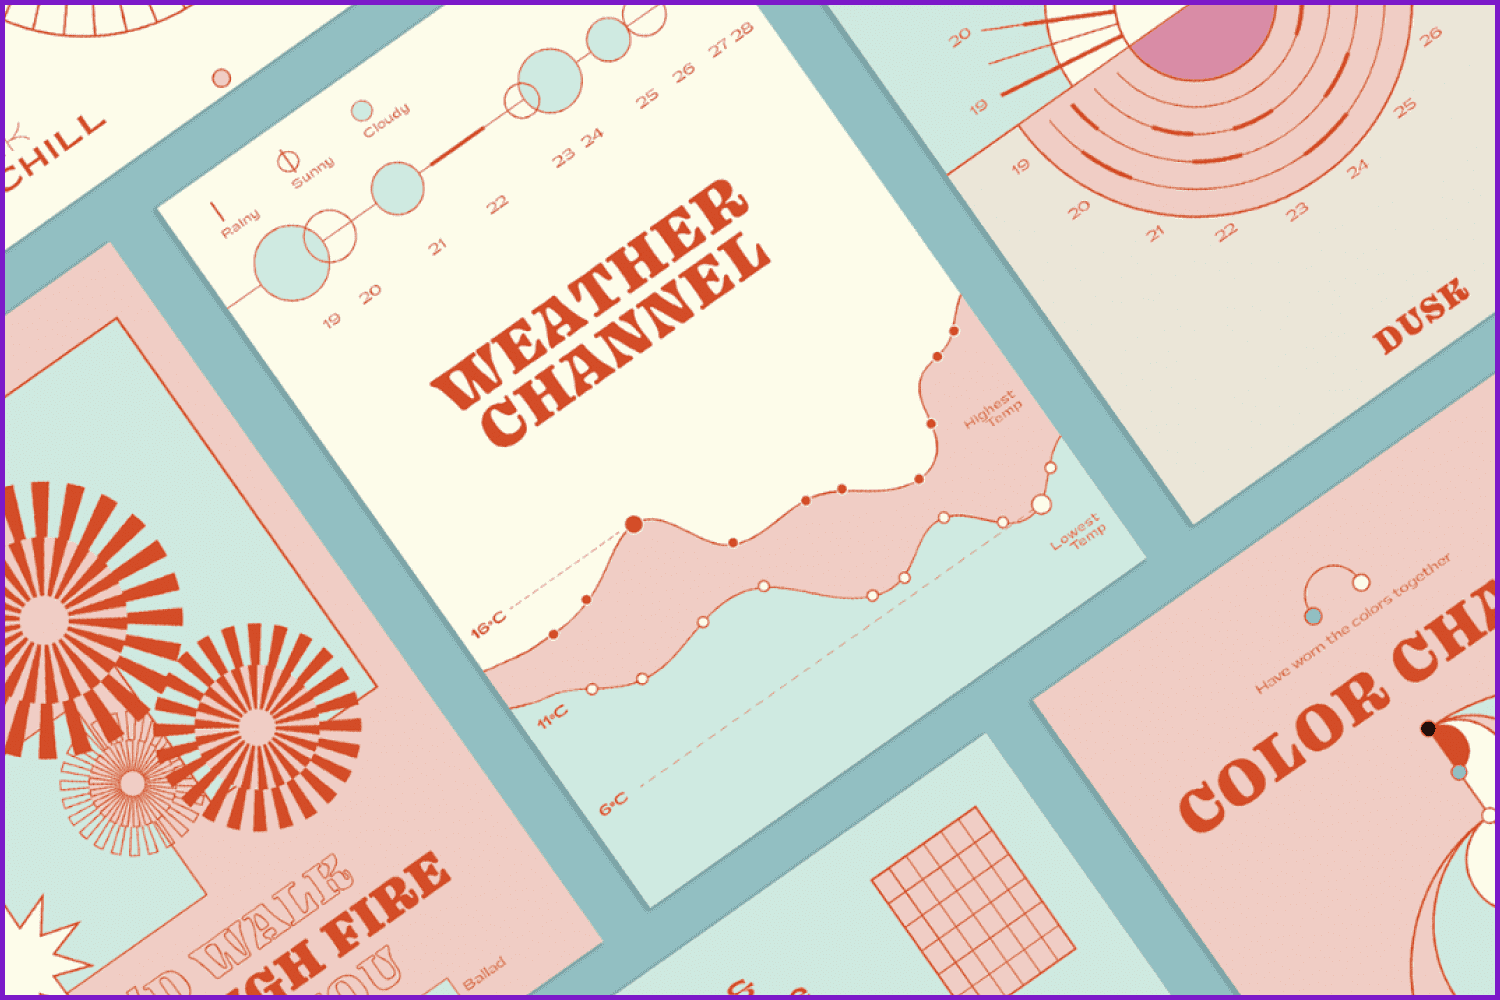
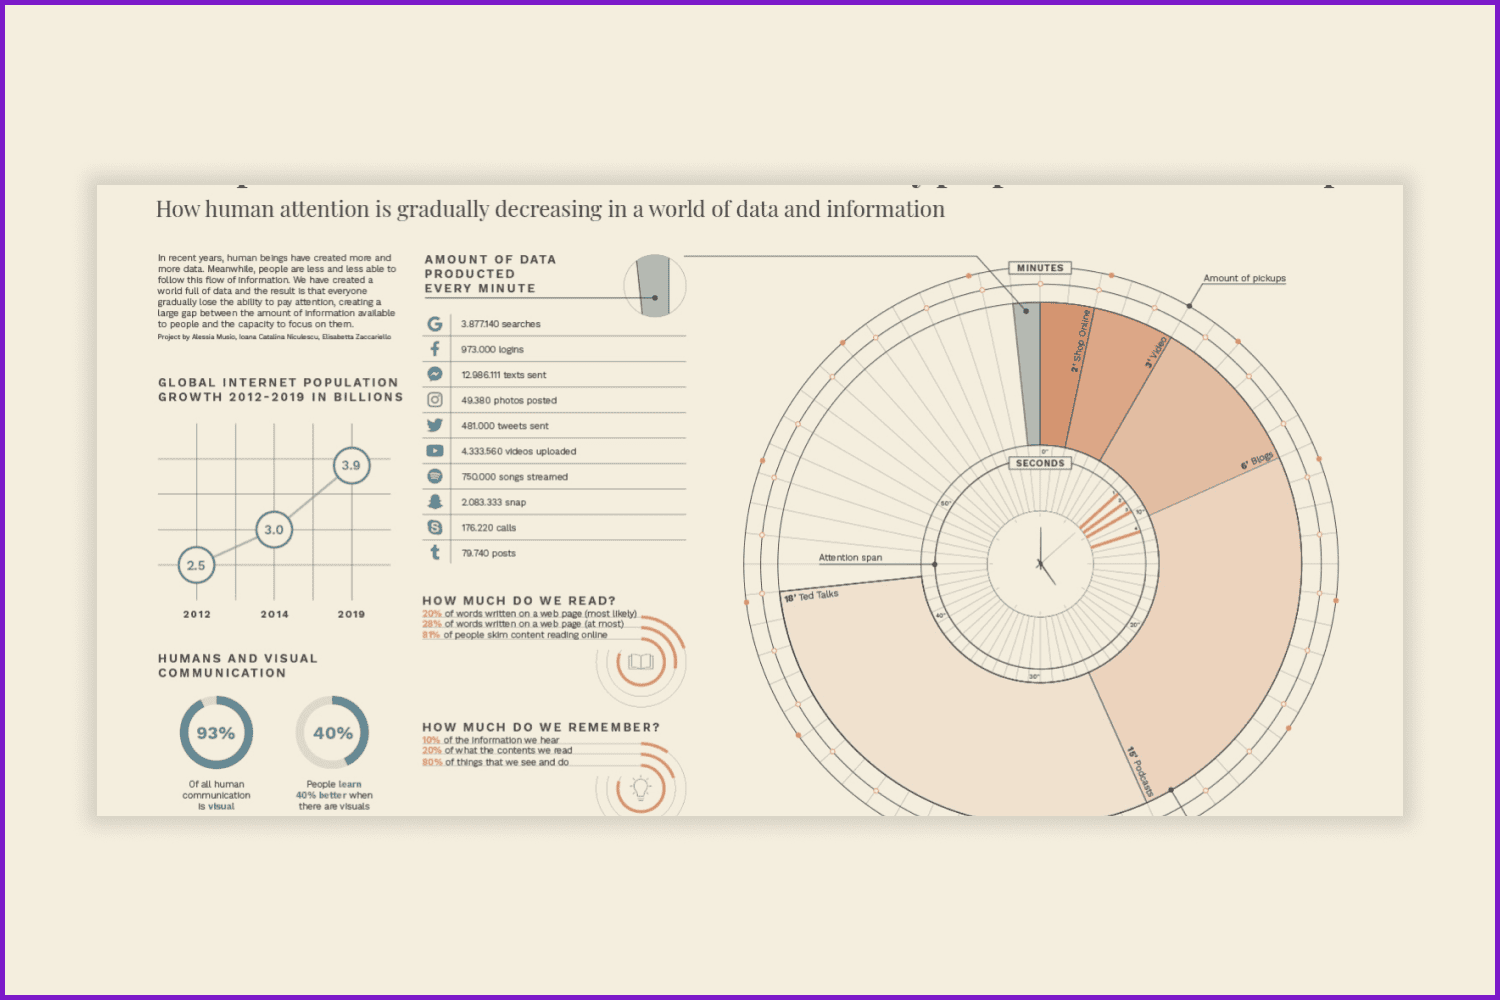
Russia-Ukraine conflict 2021-2022 designed by Mohammed Fayaz and Anatomy of sleep by Jagoda Kolodziej
Be Accurate
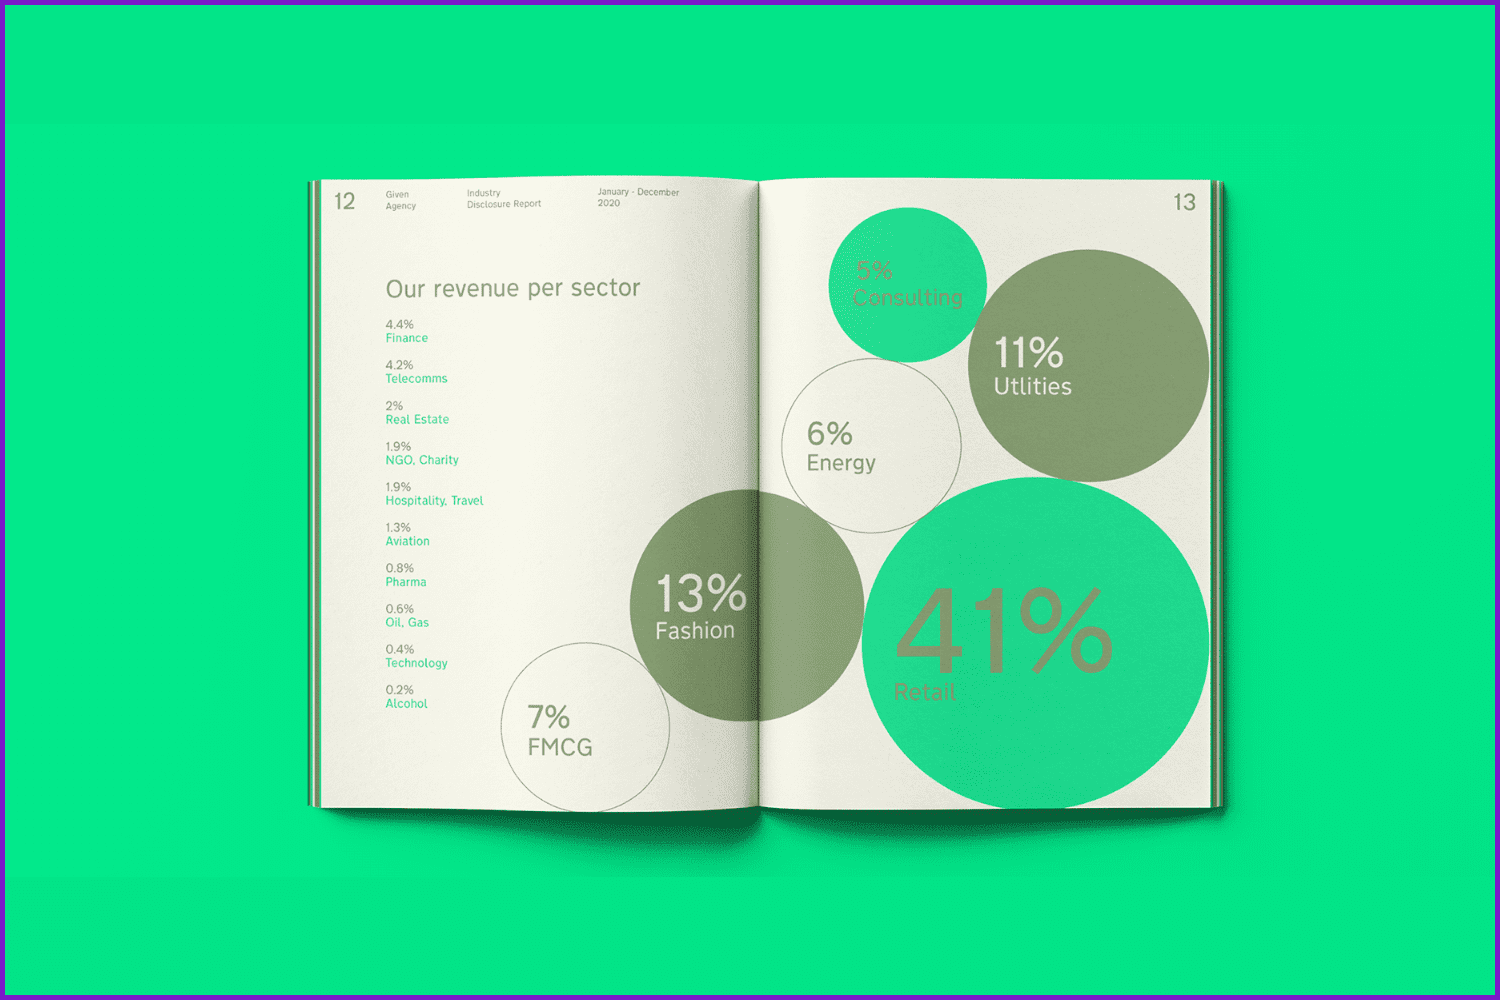
It is very easy to make a mistake when you try to create an infographic in the form of a diagram or chart. Use different shapes and sizes, and combine them with each other to provide the user with the clearest and most memorable visuals. Don’t be afraid of matching various elements, just don’t cross the line. The infographics shouldn’t seem overwhelming. And never try to draw the shapes without previous scaling. Remember about accuracy in your calculations.
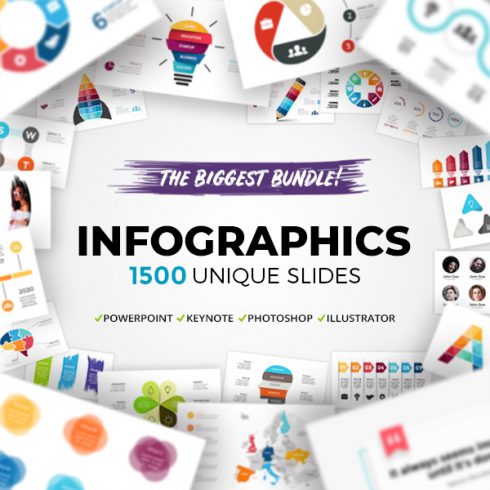
Best Cool Infographics Bundle in 2021: 1500 items:
Be Relevant
Looking for your own style, don’t forget about the matching topic and appearance of your infographic charts. A flashy infographic will rarely fit a serious theme and vice versa. Choose an appropriate design and infographic tools for your creations based on the topic and audience it is created for.
Venngage – Visualize your ideas
Learn how to make an infographic in 5 easy steps with this episode of Infographics 101. Sara walks you through how to plan and create the perfect infographic – no design experience needed.
Services for creating infographics
Today there are many services that help to create original and outstanding, truly professional infographics. Let’s see a couple of the best:
Canva
Canva has a convenient and simple builder for creating a vertical and horizontal infographic, and a large number of both free and paid infographic templates. The infographic posters can be saved in PNG, JPEG, or PDF.
Mind Master
This tool is perfect for visualizing data if you want to draw a cause-and-effect relation or a funnel of associations. Mind Meister has a large number of templates and a simple, intuitive interface. In the center is the first circle to build the mindmap. On the left, is a panel to manage the structure of the graph. On the right, a panel for editing the graph: you can change the background, and font color, insert a sticker as a smiley or add a note to the babble.
Visme
Visme app is suitable for creating presentations, animations, banners, infographics, reports, forms, etc. The free version has only three templates for infographics, but even this functionality should be enough for basic slides.
Infogram
Service Infogram allows you to create infographics quickly and easily. You can add a graph, chart, image, header, quote, text field, and works are saved in the cloud storage. The only flaw is the small number of templates that are available.
Piktohart
Piktohart is a great service for creating a one-page infographic, presentations, posters, and flyers. You can make stylish and interesting templates. Besides, there are a wide variety of tools: graphs, charts, and histograms.
There are no limits to your creativity. Just try, create, get inspired, and amaze the world with your awesome infographics.

Article reviewed by

What are design principles of creating infographics?
Use a consistent font style, color palette, and picture and icon style throughout your infographic design to keep it looking cohesive. This will keep your infographic from looking confused and will actually make it easier for your audience to understand.
Furthermore, limit the number of font types, colors, pictures, or icons to two to three. If you choose several colors that don't work well together, for example, your infographic's consistency will be broken, and its effect will be diminished. Visual consistency is essential for establishing an infographic design that effectively conveys and engages the audience. It's also one of the most useful infographic design suggestions you'll ever receive.
Article reviewed by

What are design principles of creating infographics?
The design principles of creating infographics are pretty simple: make sure the information is easy to understand and visually appealing. In other words, you want your audience to be able to quickly grasp the main points of your message, and you want to do so in a way that is pleasing to look at.
To achieve these goals, there are a few basic design rules you should follow when putting together an infographic. First, use short paragraphs and clear headlines to break up the text and call out key points. Second, use high-quality photos and visuals to add interest and appeal. Third, use bold colors and simple graphics to emphasize important information. And finally, make sure your layout is clean and organized.
FAQ
Here are a few frequently asked questions about the infograhic.
How to make an infographic?
Anyone can create an infographic from scratch by following the simple design rules outlined in this giude.
How to make an infographic on Google Docs?
With some effort, it is quite possible to create a simple infographic in Google Docs. This application is well suited for statistical data. Read this tutorial to learn how to do it.
How to make an infographic in MS Word?
It is also possible to create a great infographic in MS Word. Just check out this cool video guide by Lisa Doe and follow each step to learn how to do it.
How to create an infographic in PowerPoint?
If you want to learn how to make an infographic in PowerPoint, you are welcome to watch this amazing video tutorial.
How to Create an Infographic in 8 Simple Steps
Whether you are an experienced designer or a creative newbie who has only begun making some outstanding designs, you need to take a minute to recognize the trend and create some unique art that follows the best design principles. In this video, we have collected some hot design topics that you should follow in order to master your talents in the right direction, create up-to-date infographic templates, and as a result, be a high-demand graphic specialist.
What are your concerns?
Thanks for your response!
Disclosure: MasterBundles website page may contain advertising materials that may lead to us receiving a commission fee if you purchase a product. However, this does not affect our opinion of the product in any way and we do not receive any bonuses for positive or negative ratings.