How to Create a 5-step Pie Chart Infographic and Animate It
There are so many pitfalls you should know to create an eye-catching presentation! To learn some, check out our useful tips to design your PowerPoint Presentation in 2022!
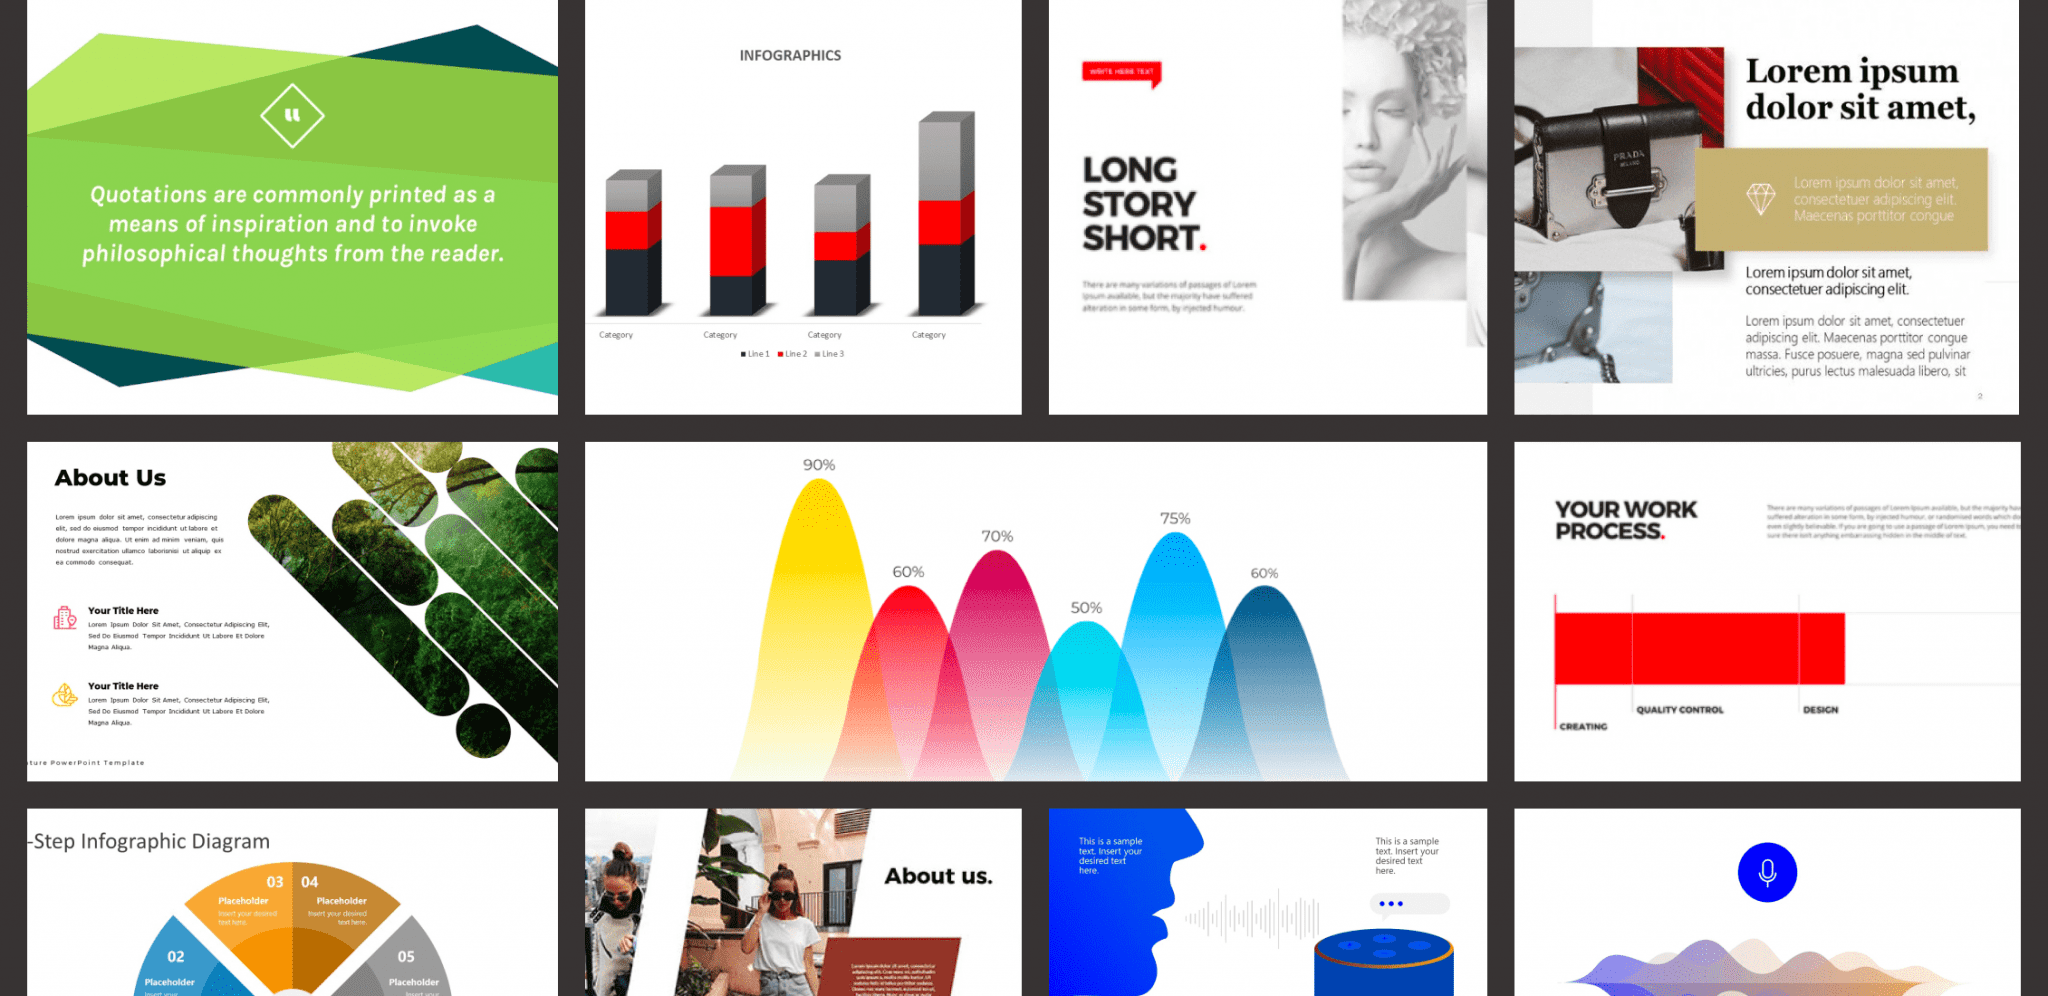
Best Related Products


What Is It For?
You are probably wondering, what is the point of all these animations, if the old-fashioned way is to put everything in a spreadsheet, or even just text? The answer is quite simple. Just ask yourself why we now drive comfortable cars and not horse-drawn carriages.
This animation method allows us to beautifully and accurately structure the information in a semi-circle design, which is also easy to read. But it also attracts more attention from the viewer, because they will immediately notice that it is not plain text with lots of boring information, but neatly arranged sections of interesting content.
In addition, such visual material is much easier to remember. In this tutorial, we will show you how to make animation quickly and easily. We will work using a cool video from the YouTube channel PowerUP.
122.PowerPoint Animations – 5 Step Pie Sections Infographic animation
Hello PowerPoint Users.! I am a PowerPoint Designer, using Office 365 latest version in all my Graphic Illustrations. These PowerPoint Tutorials will take you through PowerPoint Basics to Advanced Graphic Design Techniques, enabling you to design your own Professional PowerPoint Presentations for all your business needs.
There you may also find a lot of useful information and amazing tricks for working with PowerPoint. If for some reason you do not have time to learn it or something does not work for you, then you are always welcome to use any of our high-quality and easy-to-edit templates for PowerPoint.
Finally, at the end of this tutorial, we will have an awesome animated infographic, which you can check out below. Great, isn’t it?

GIF by MasterBundles
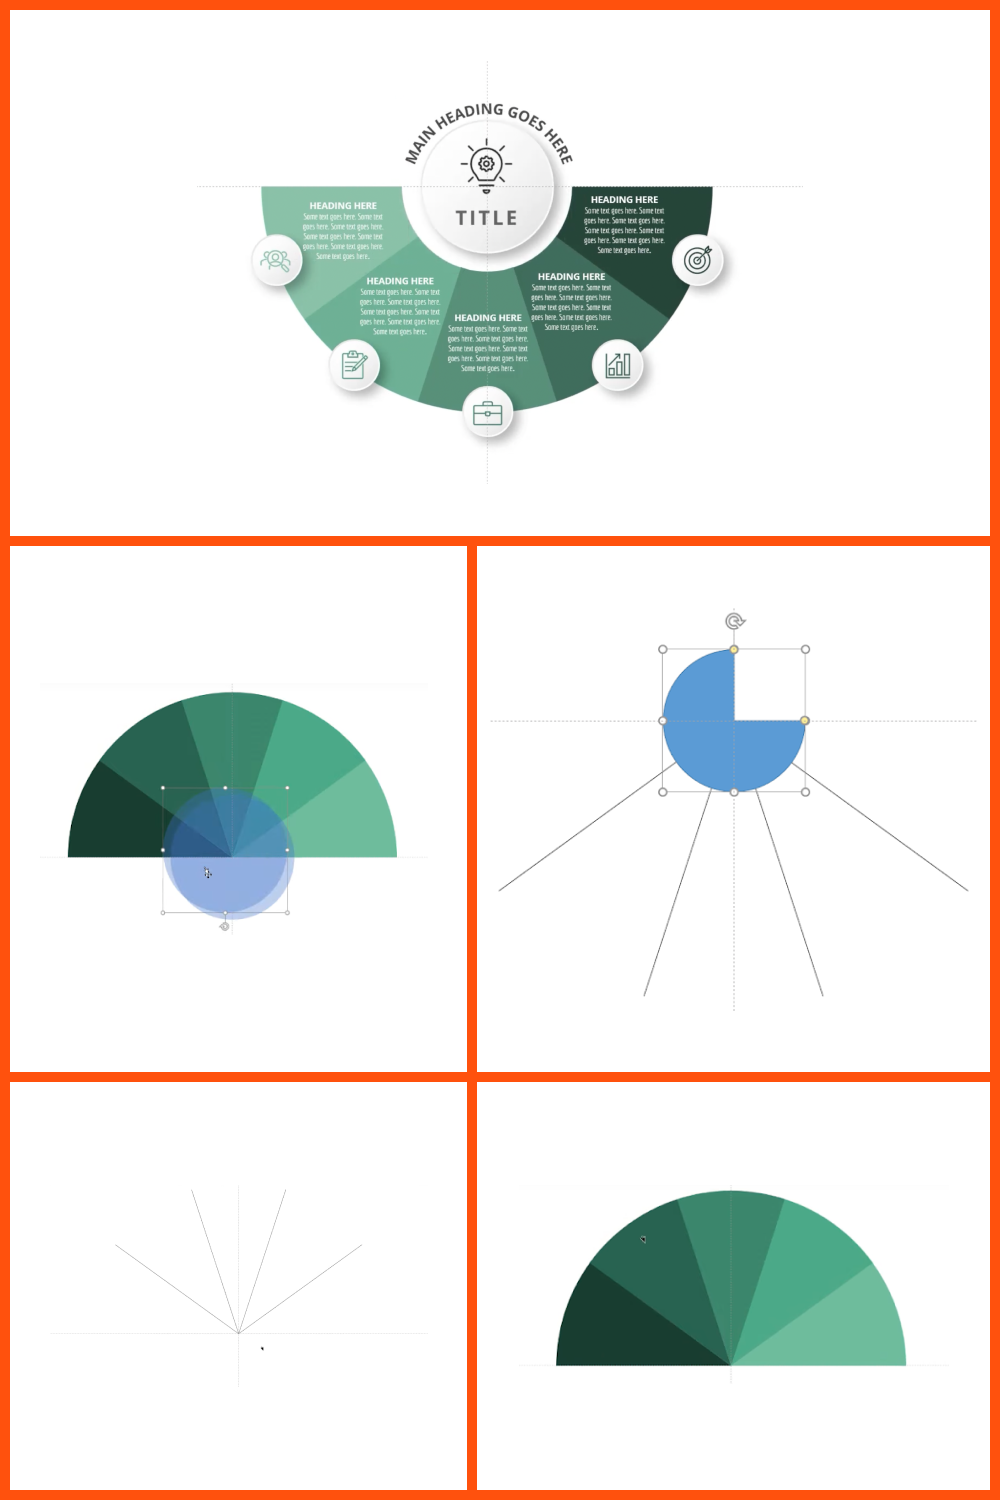
How to Create a 5 Step Pie Sections Infographic in PowerPoint
To display guide lines on our slide, go to the View tab and click the checkbox for Guide. Now we have directional lines, and we have to move the horizontal directional line up vertically by 1.5. Note that in this tutorial we are using the U.S. measurement system.
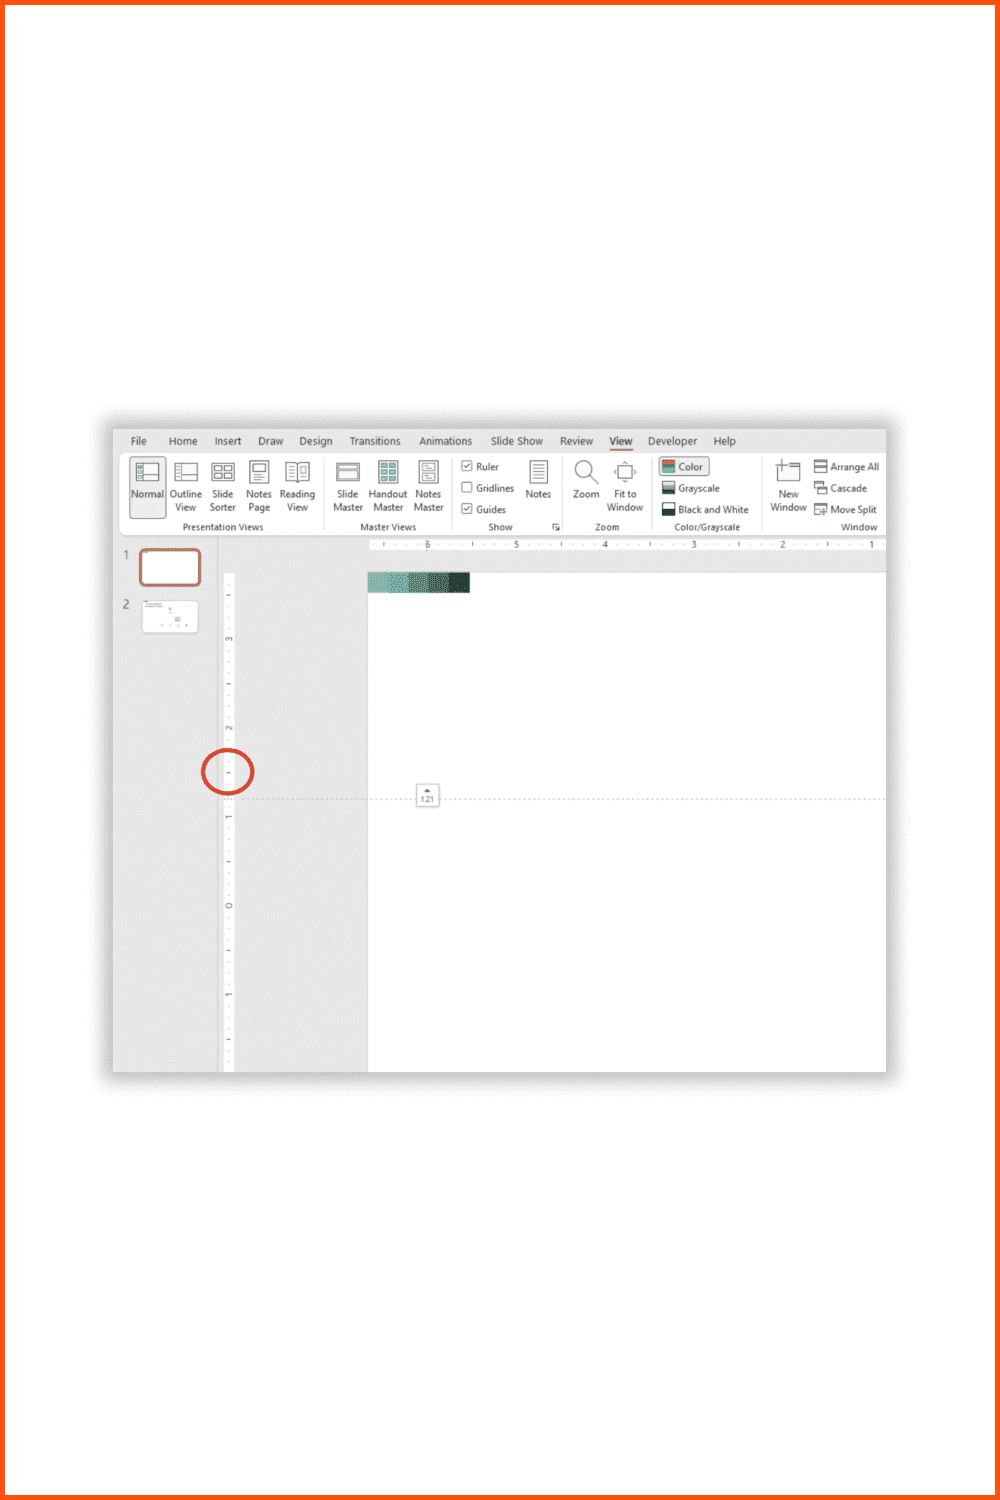
Image by MasterBundles
Now we create a kind of frame for our figure. To do this, go to the Insert tab and select a line, which in turn is drawn on the right side of the horizontal line and colored in black. Right-click on our line and select Format Shape.
Next, go to Shape Properties and choose to edit the size of the shape. In the Rotation field put 36 degrees, as we will make 5 sections and consequently 180/5 = 36, remember this number. Here we use the keyboard shortcut CTRL+ D to copy our lines to four units. And now from the initial line, which is rotated at 36 degrees, we add another 36 to each subsequent line. Now that we have 4 lines at different angles, with one end of each line we adjoint it to the middle of our coordinate system, in other words adjoint them to 0.
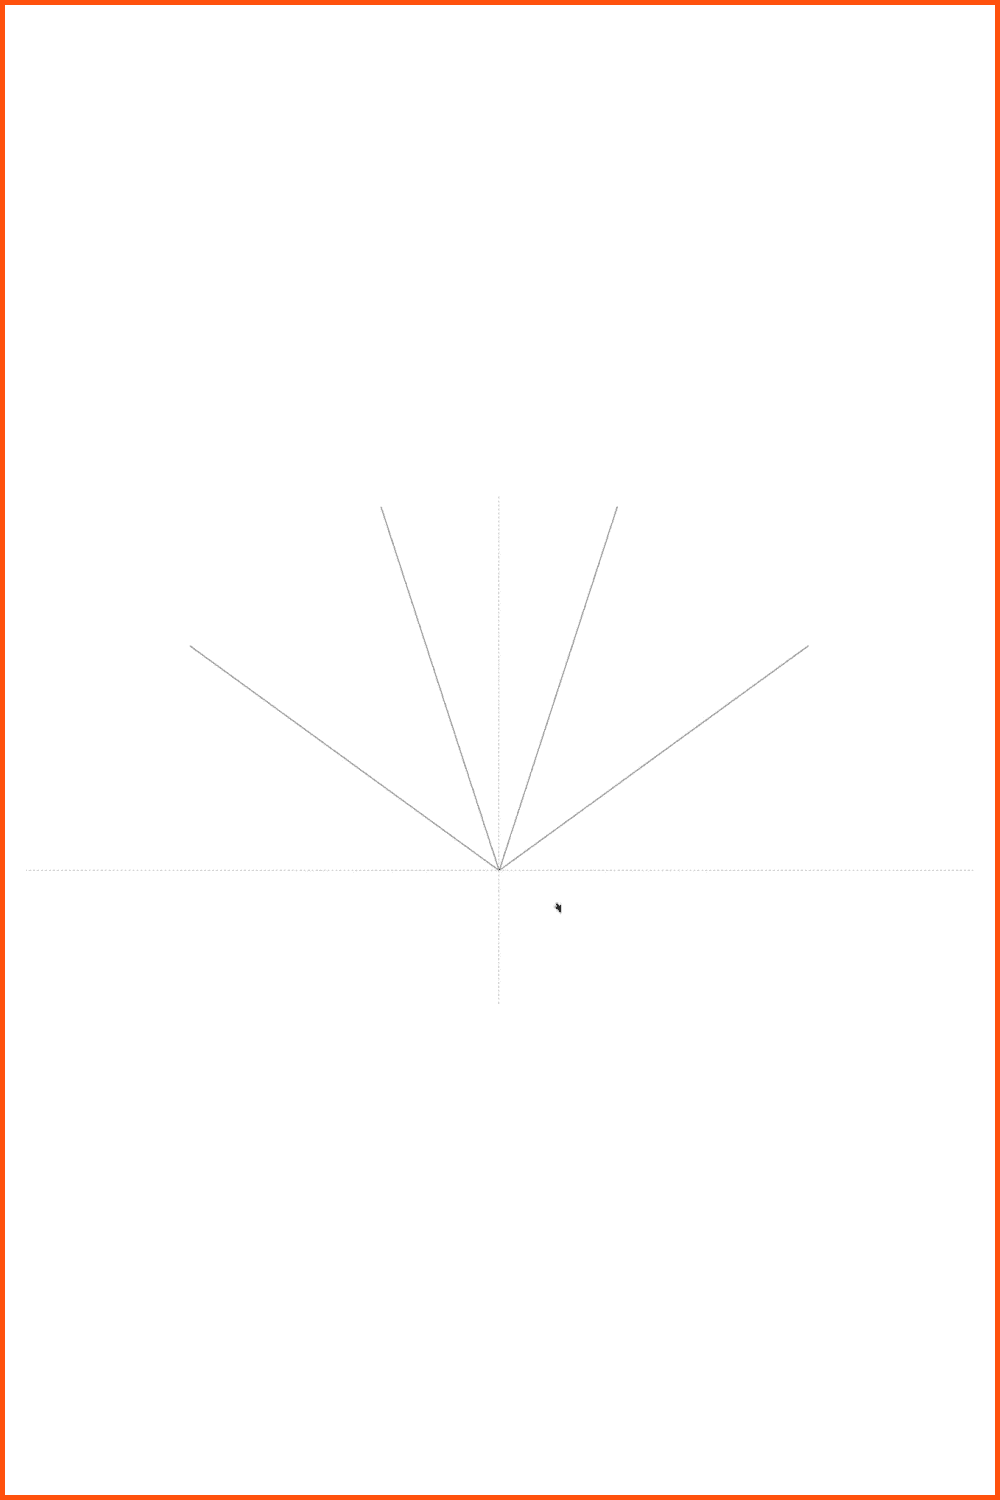
Image by MasterBundles
It should look like this. Do not worry if your lines are a little shorter or longer, it will not affect the end result in any way.
Next, go to the Insert tab and under Shapes, select Partial Circle. It will not appear on the slide immediately, you can insert and scale it using the combination CTRL+ SHIFT+ DRAW.
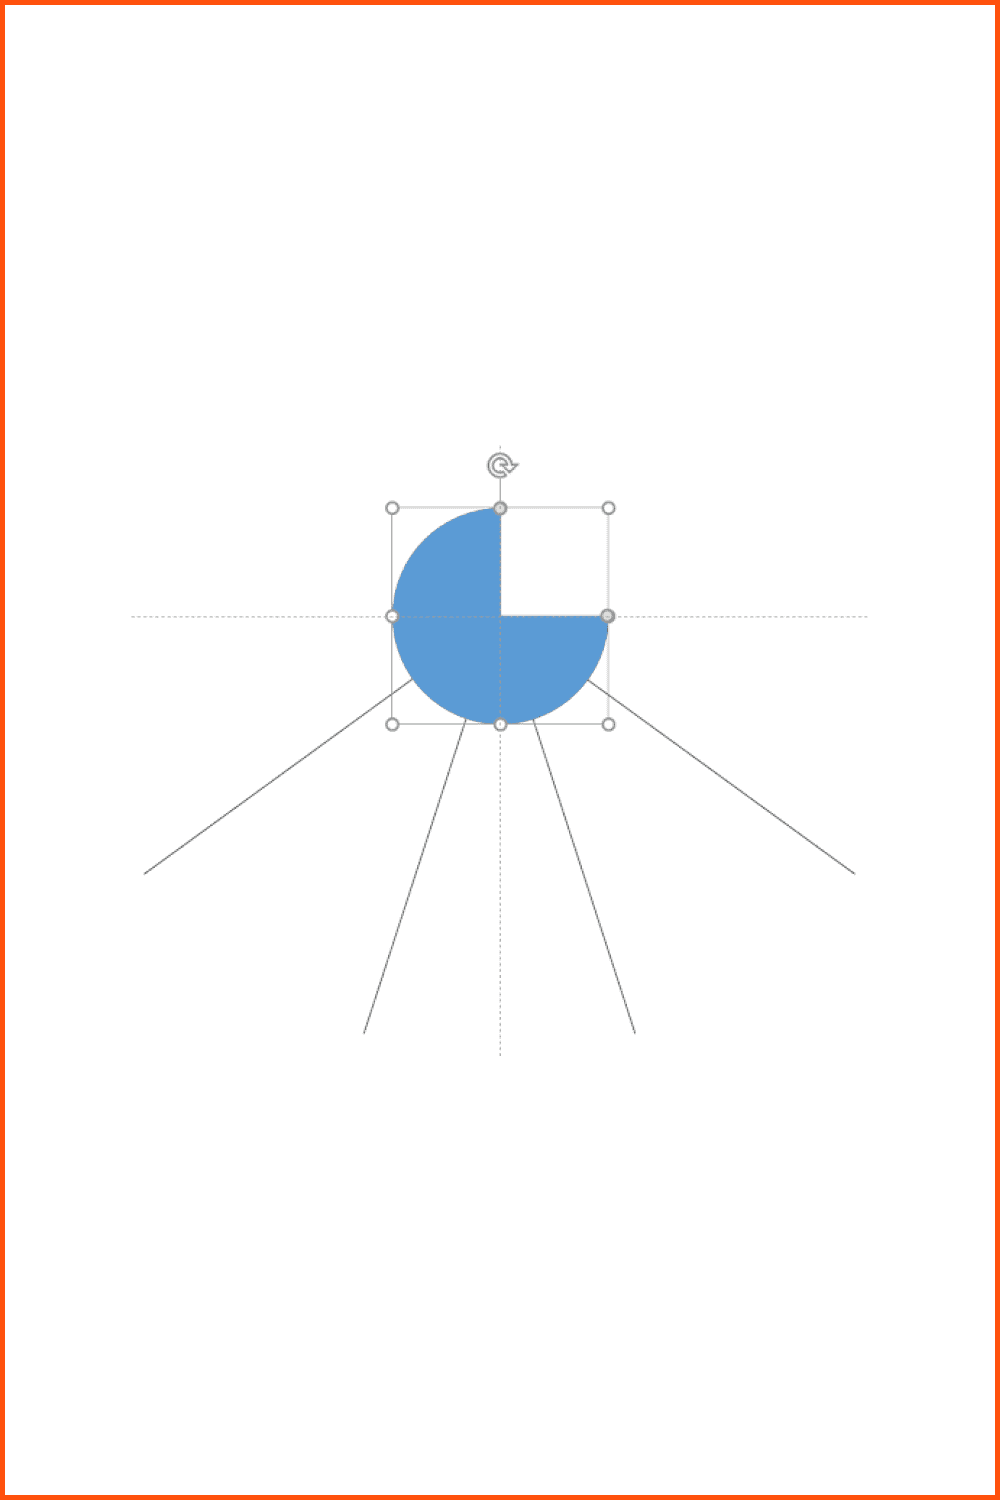
Image by MasterBundles
Now we need to reduce this shape slightly to the state shown in the picture below. This is quite easy to do, just grab one of the endpoints of this shape. You may also adjust its transparency in the properties, for convenience.
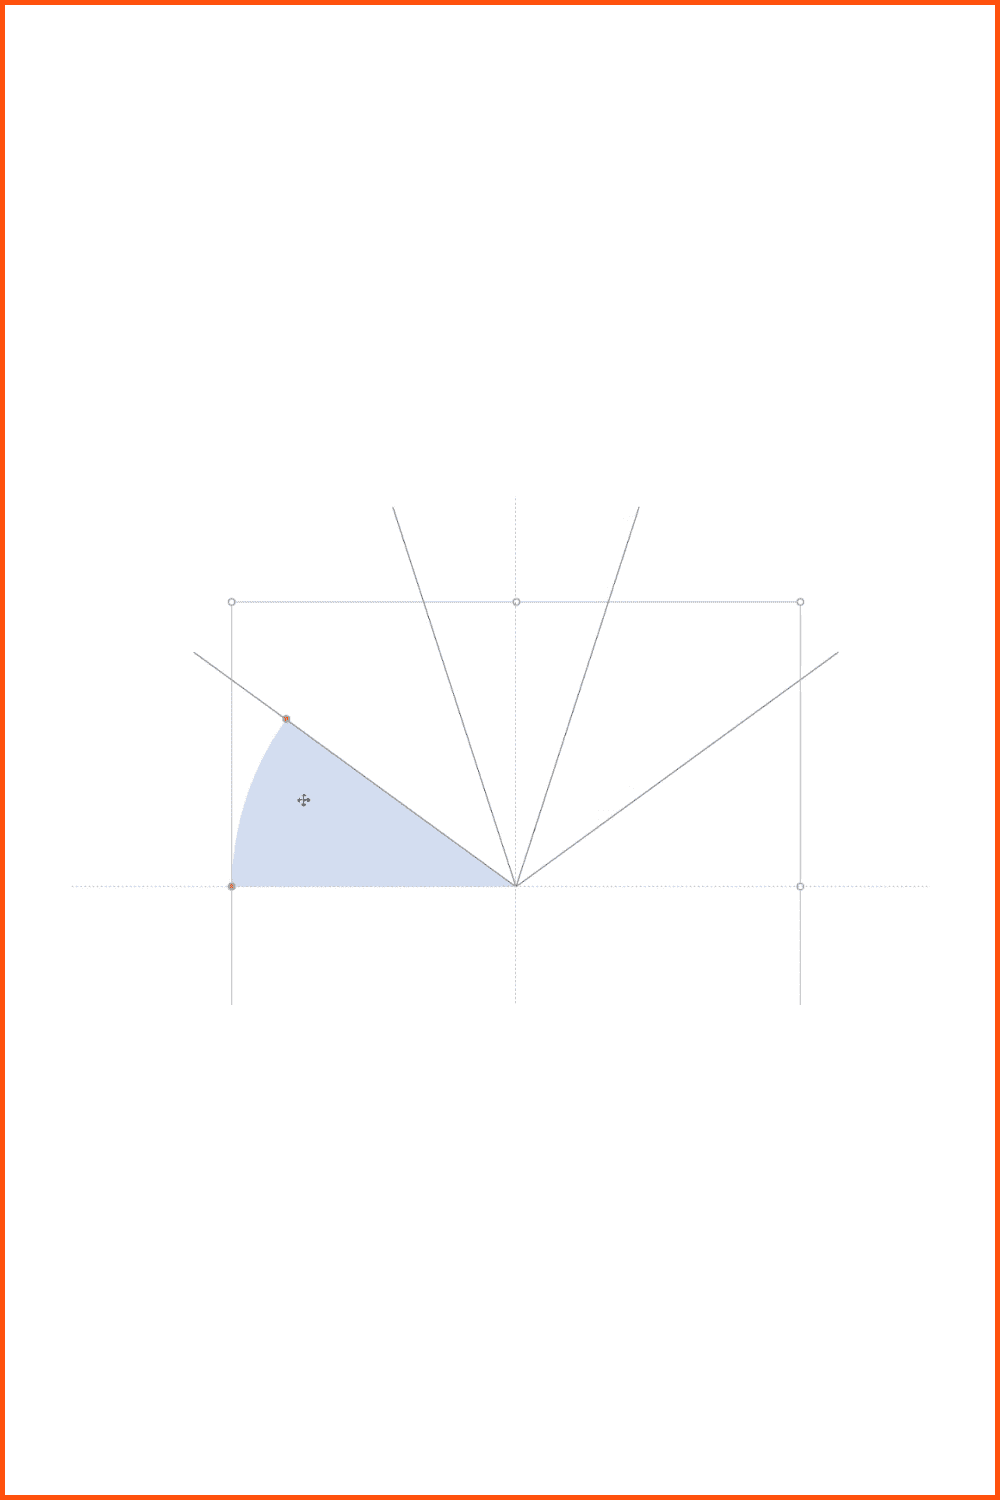
Image by MasterBundles


The next step, similar to working with lines, we need to copy this shape and position it at the same angle as our lines. This is also done in the Properties tab of this shape. If something does not match, pay attention to the dimensions, because maybe they are the problem.
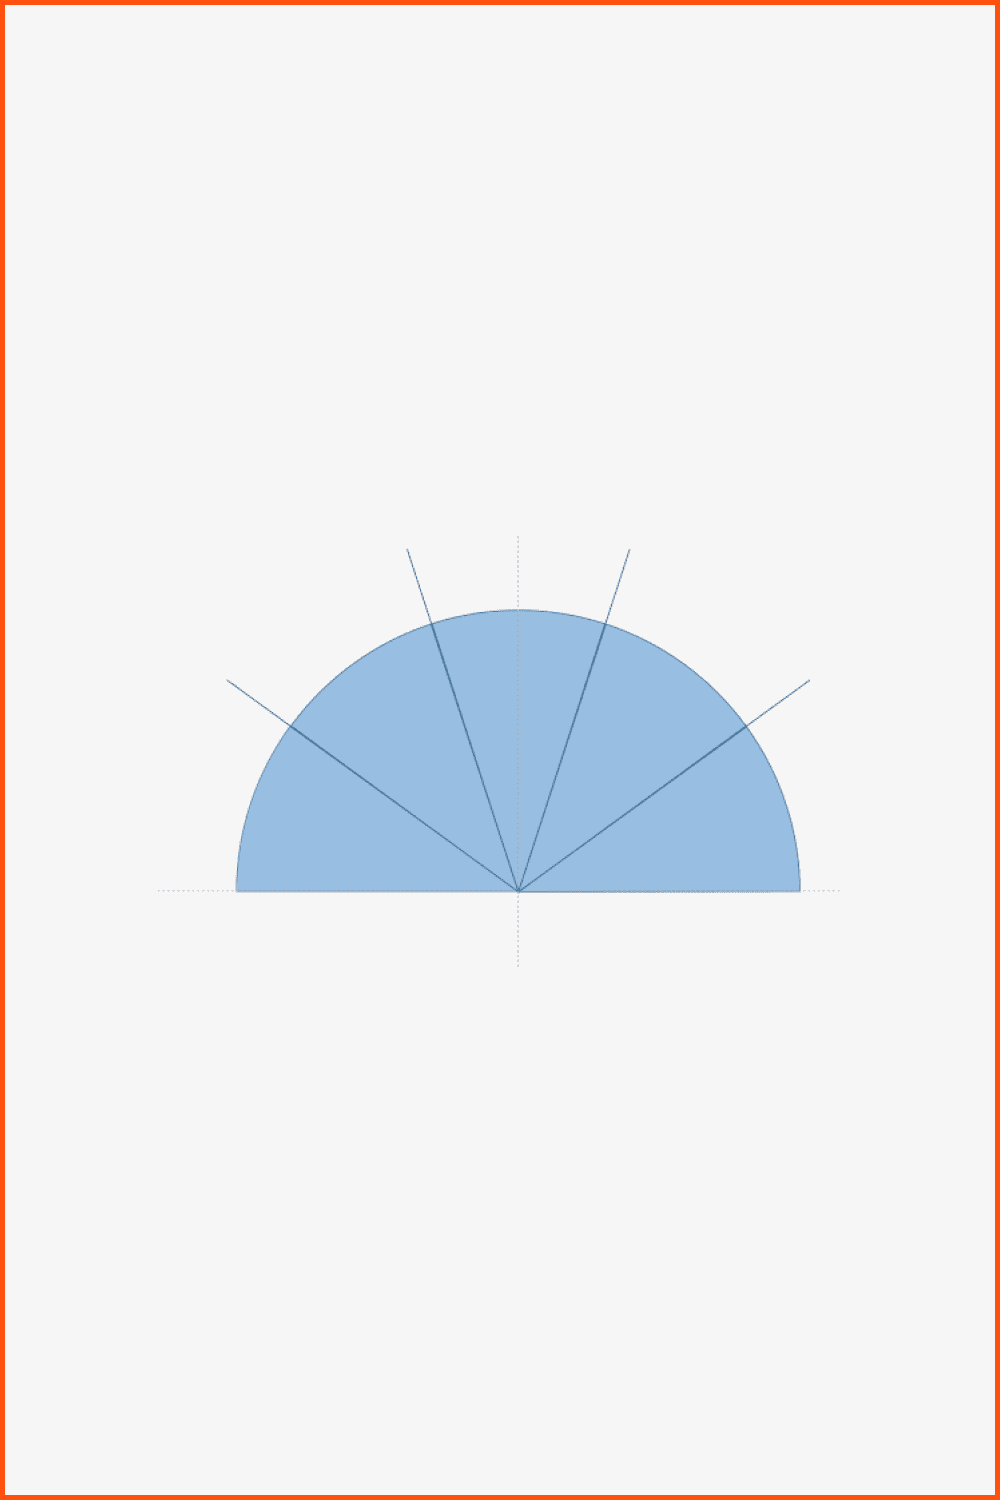
Image by MasterBundles
Here is the right time to color our shapes. You are free to select the color of your preference, but it is desirable to fill from dim to more saturated. You can see an example in the picture below. The coloring was done with the Shape Fill tool.
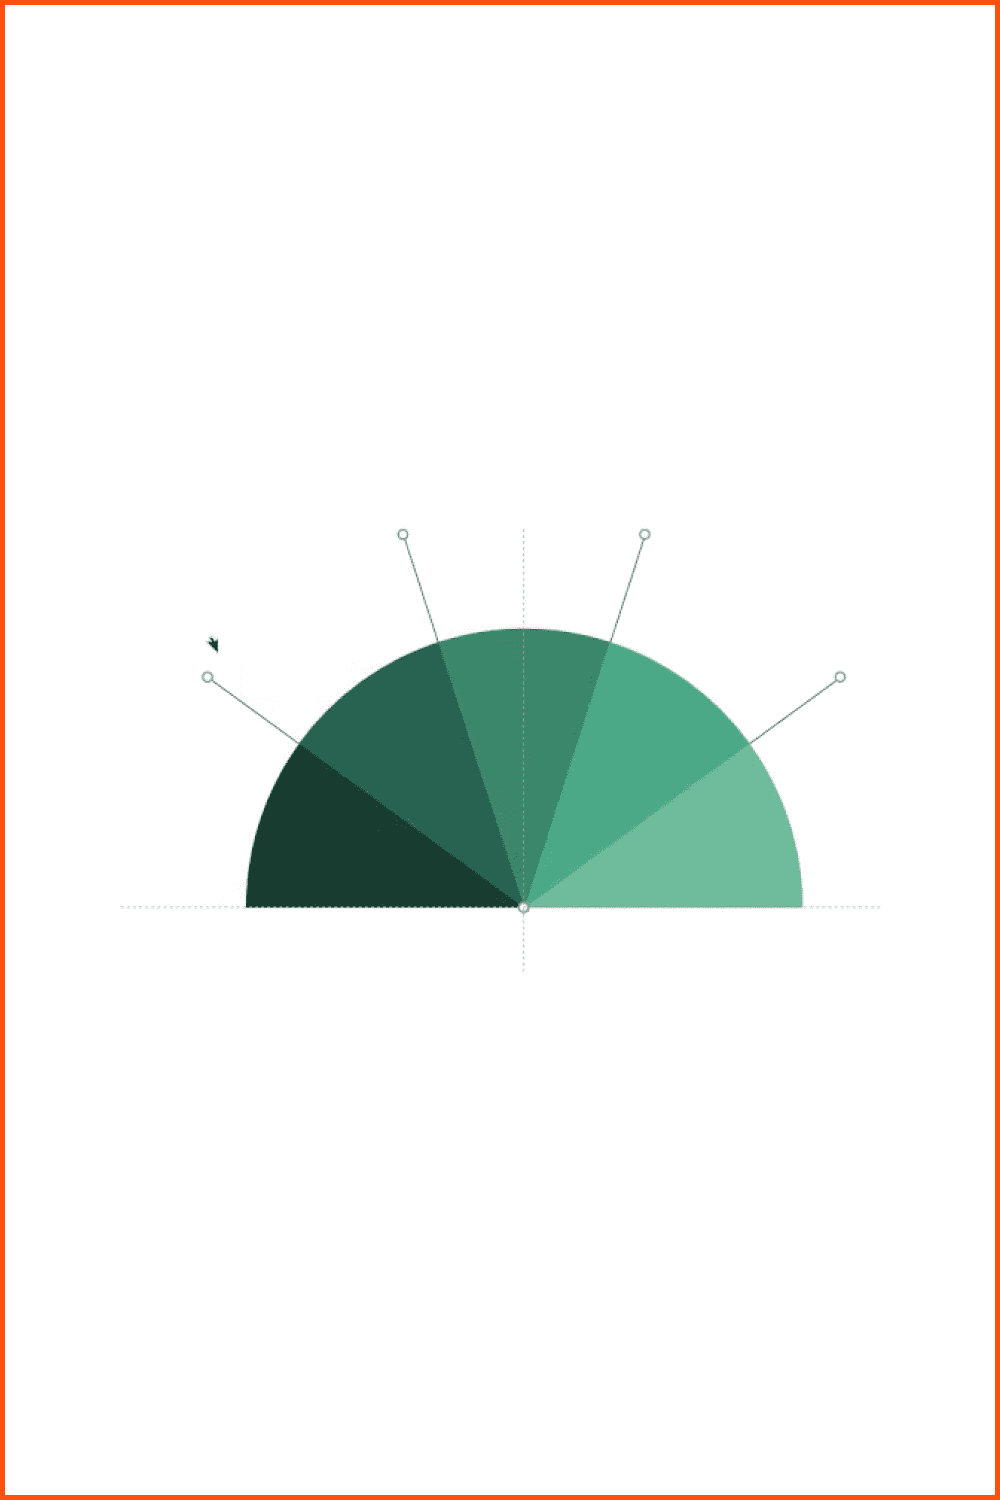
Image by MasterBundles
Now we do not need the lines and can get rid of them, just select them and use Delete to remove them.
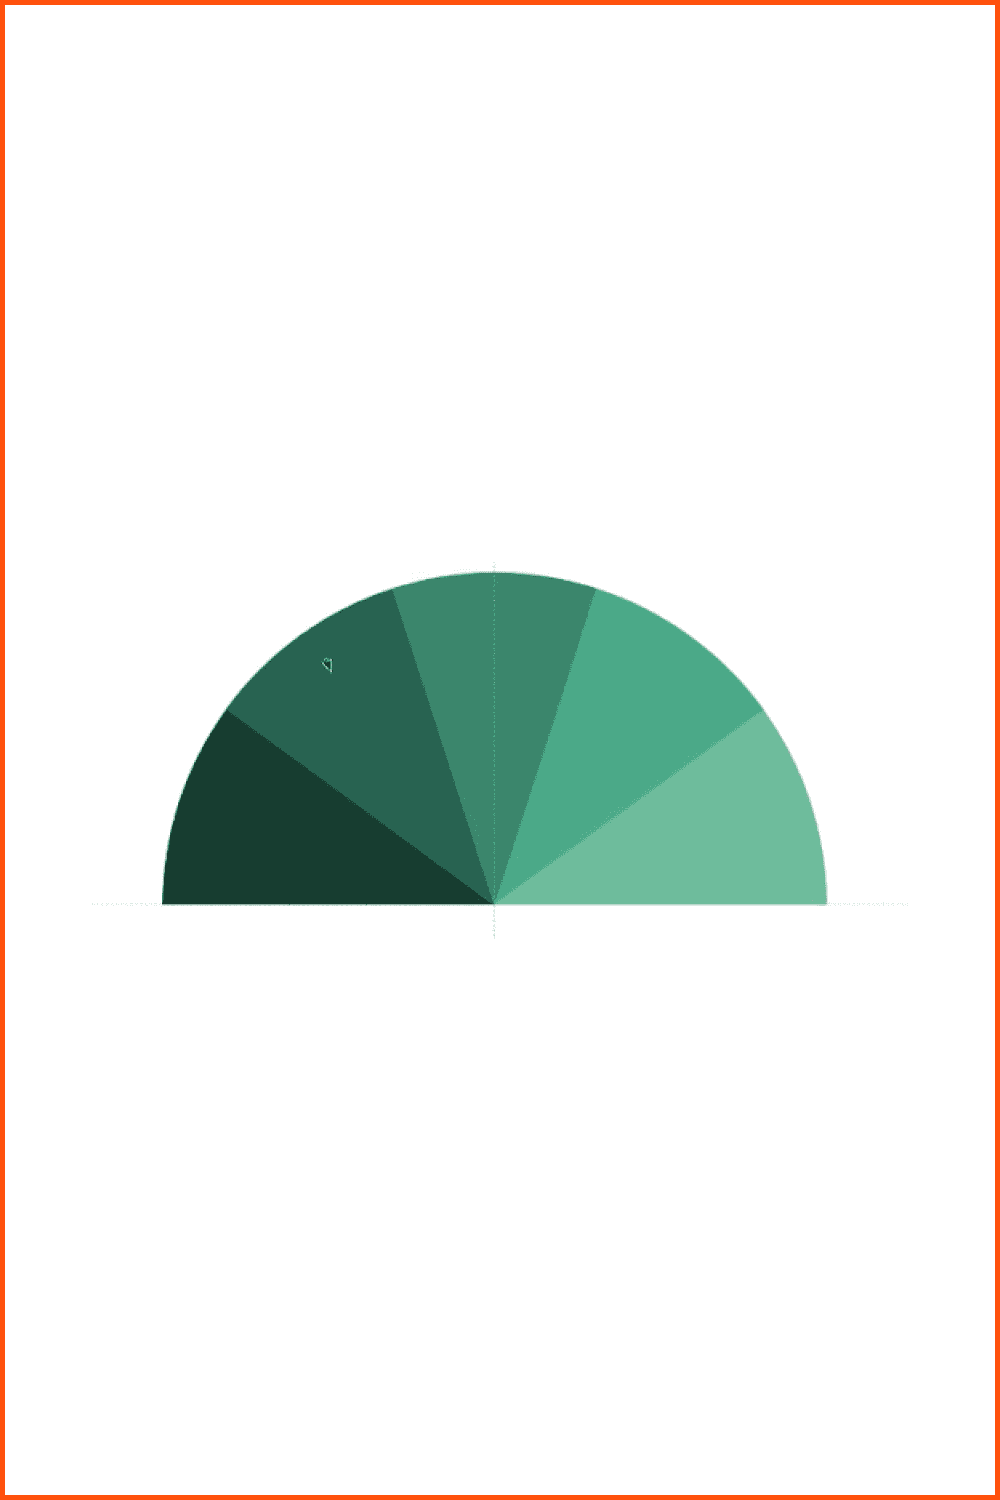
Image by MasterBundles
As we have done before, we need to add another figure. Just like we did before, go to Insert and select Oval. Put it in the middle of our coordinate system and copy it to create 4 more copies, which in turn overlap each other in the center.
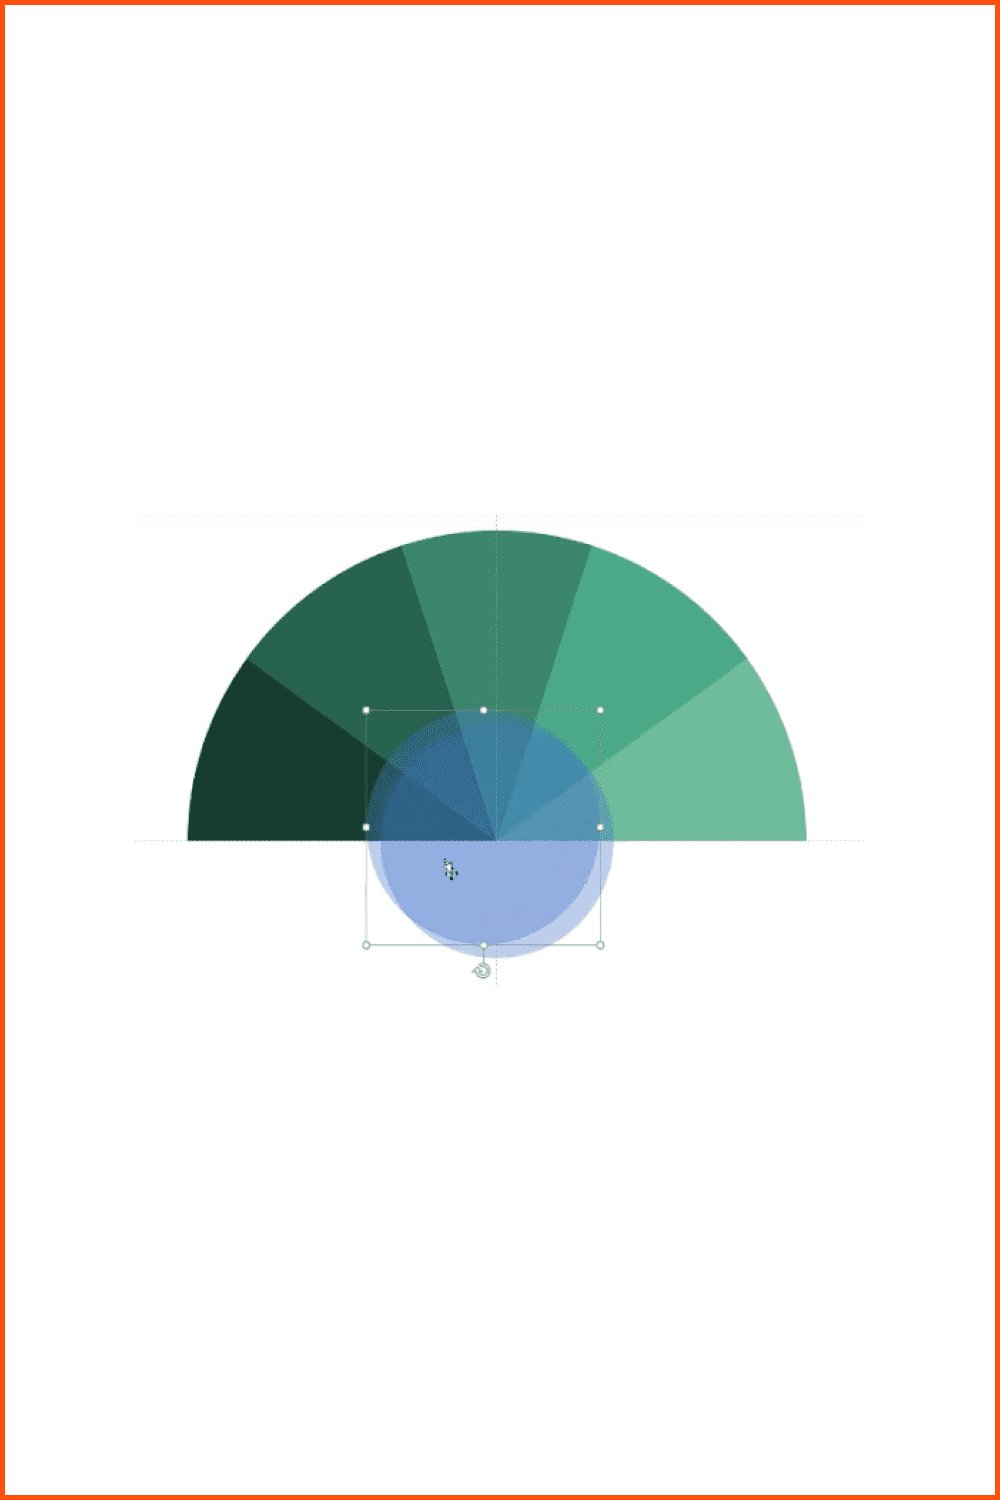
Image by MasterBundles
Now we need to merge the figures. To do this, we first select them, and then go to the Merge Shapes tab and select Subtract. Do not forget that this operation has to be carried out on each figure and if you have done it right, you should get the following:

Image by MasterBundles
The next step is to bring back our oval. For that we do everything the same way we have done previously. Now make it a gradient fill. Here you have a full flight of creativity in the choice.
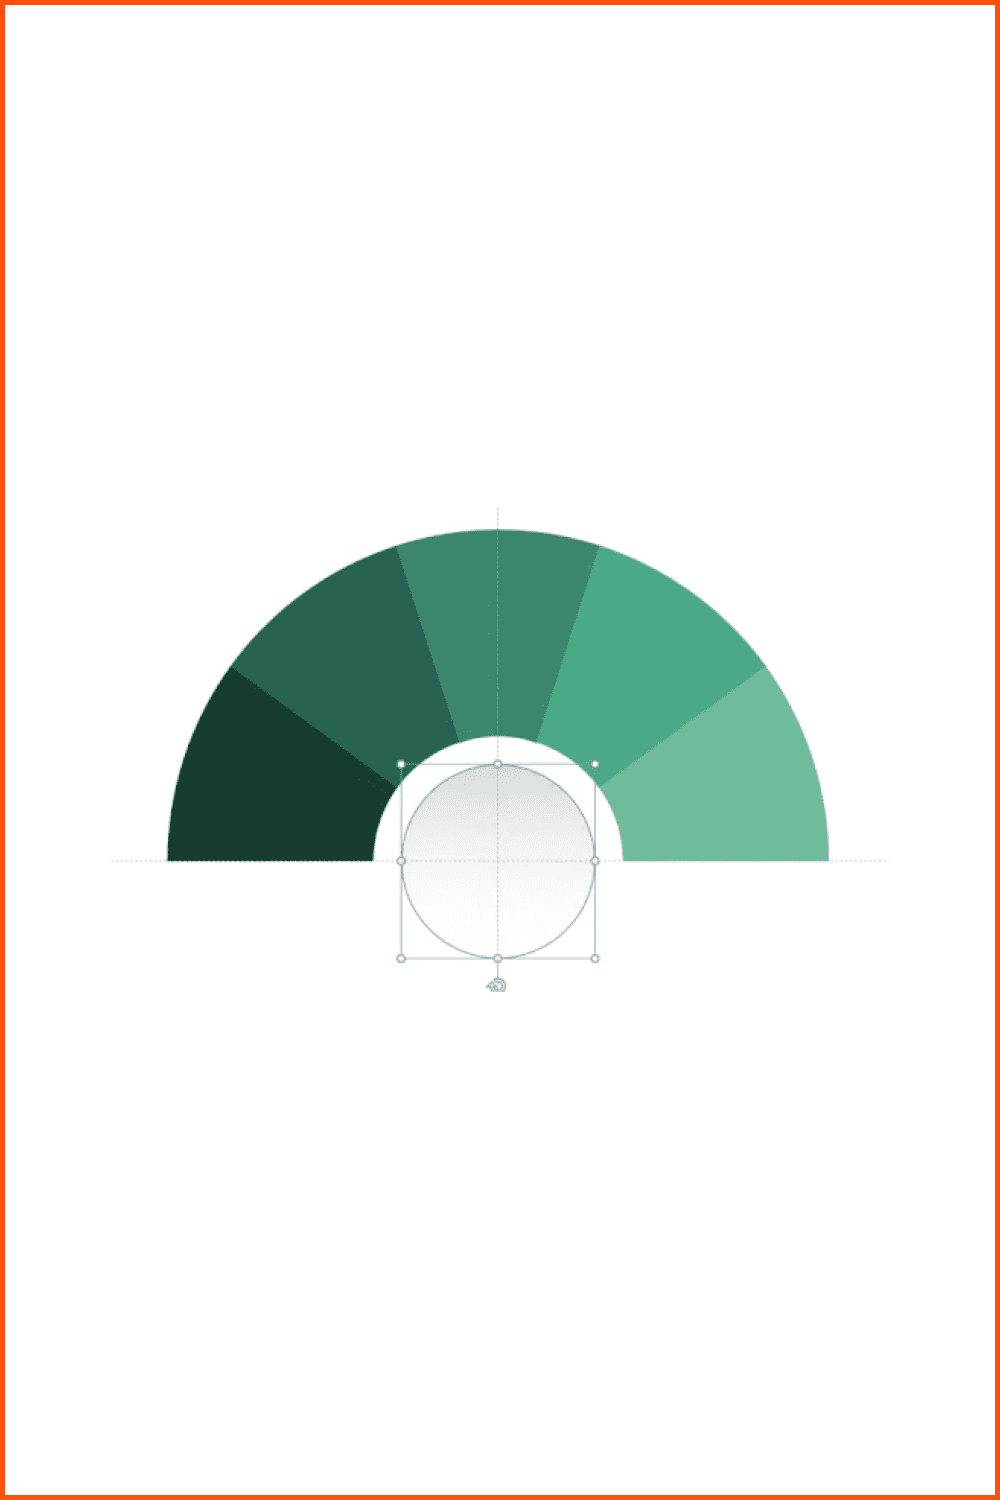
Image by MasterBundles
Now is the time to copy our circles, reduce them, and place them roughly at the end of each section. This is done as usual with CTRL+D. We have also prepared text and pictures to put in the circles. You are free to substitute something of your own, which can be absolutely anything. The result should be similar to the following:
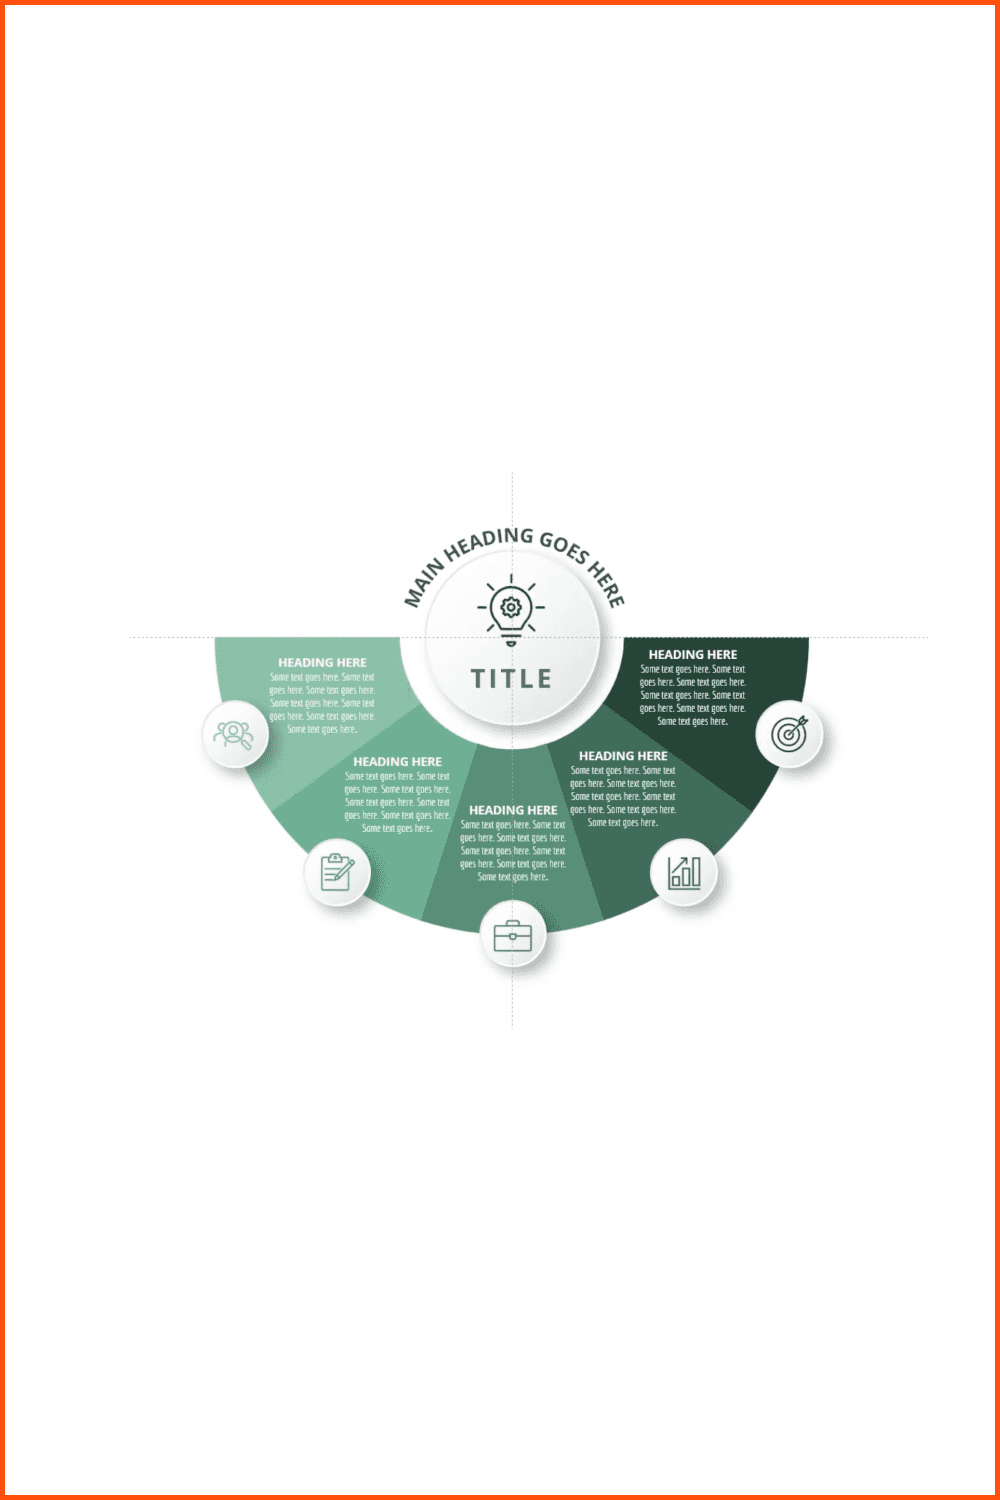
Image by MasterBundles
How to Animate a 5 Step Pie Sections Infographic in PowerPoint
In this section we are coming to the end and creating an animation. In fact, you can let your imagination run wild and substitute the animation that you like. However, we still have some technical points to explain to you. Remember that if you do not understand something or want more interesting and cool tricks for working with PowerPoint, check out this useful YouTube channel. There are lots of helpful tips on how to work with even the easiest elements of presentations.
Now, as far as animation is concerned, you need to go to Strange Animation and click on the Animation Pane icon. Now, you select the figure you want or the text on it and you can do whatever you want with it. On the top panel you have everything you need. You may choose the animation itself, whether it is a flyout or a panorama. You can also select the direction and even the timing of this animation. However, do not forget to highlight the shape you are going to do it for before you set the parameters. Basically everything here is limited only by your imagination.
Finally, our nice animation is ready! Enjoy!
GIF by MasterBundles
Sell Your PowerPoint Templates on MasterBundles
Now that we have figured out how to make an infographic pie chart you can experiment and try to create something of your own related to animation. As you can see, this is quite simple and does not require any serious specifics, but only creativity and desire. As you understand, working with PowerPoint is very interesting and fun. And if you are a creative person who makes impressive presentation templates and knows the worth of your work, then select MasterBundles marketplace to make money and find more clients. All you need to do is just fill out the Sell Your Deal form.
- PowerPoint Templates
- Colorful PowerPoint Templates
- Business PowerPoint Templates
- Valentine's Day PowerPoint Templates
- Education PowerPoint Templates
- Professional PowerPoint Templates
- Infographics
- Backgrounds
- 3d animated powerpoint templates
- animated architecture presentation examples
- Graffiti powerpoint templates
- Infographic powerpoint examples
- Vintage scrapbook powerpoint templates
- Animated construction powerpoint templates
- Motion graphics powerpoint templates
- Comic book powerpoint templates
- Muslim religious powerpoint templates
- Pie chart powerpoint templates
Please Take a Moment to Pin This Post to Pinterest
What are your concerns?
Thanks for your response!
Disclosure: MasterBundles website page may contain advertising materials that may lead to us receiving a commission fee if you purchase a product. However, this does not affect our opinion of the product in any way and we do not receive any bonuses for positive or negative ratings.