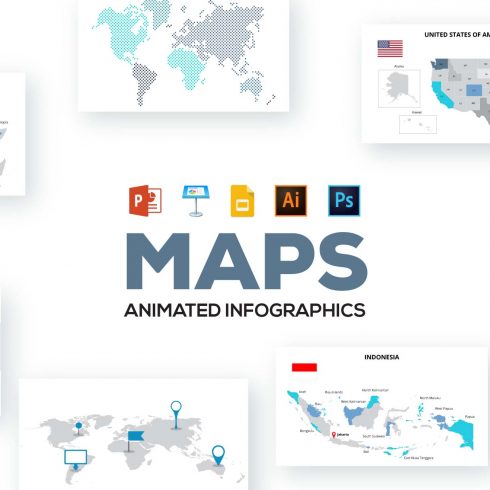
130 Animated Maps 2021: Map Infographics & Powerpoint Elements AI, PSD, EPS, PNG, XML, KEY, PDF
$24
| Created by | Cartorical |
|---|---|
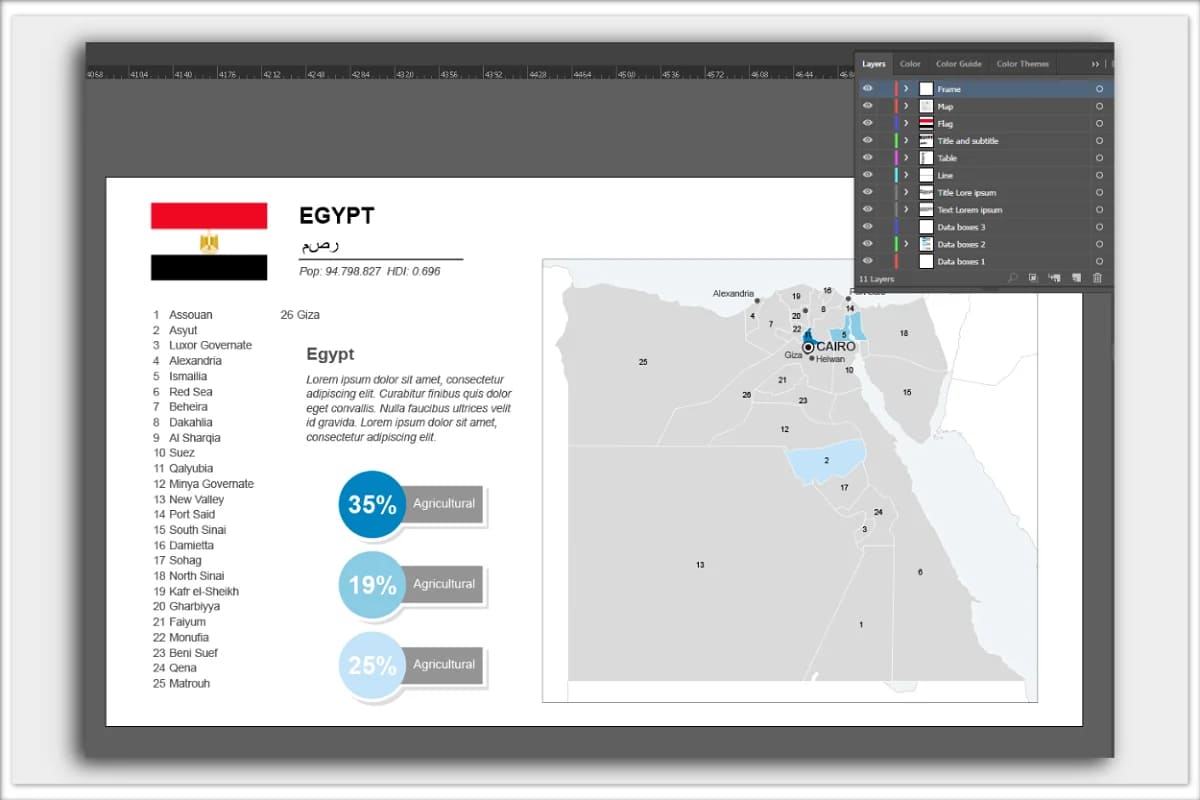
| File type | AI, PDF, PSD, SVG |
| File size | 1.11 Gb |
| Date of Creation | August 1 2022 |
| Color | blue orange red white |
| Rating | 4.9 (14) |
| Category |
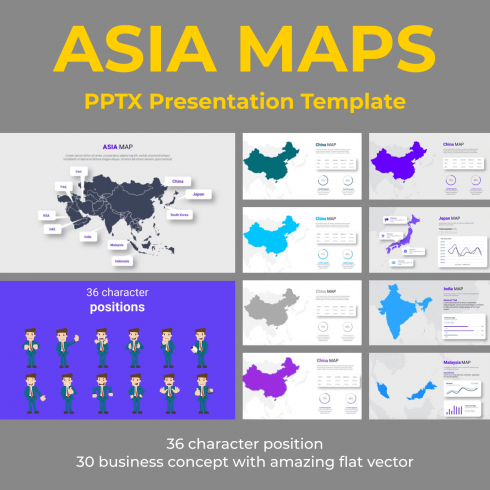
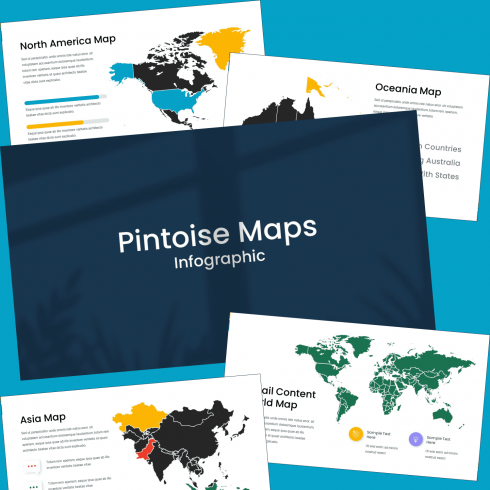
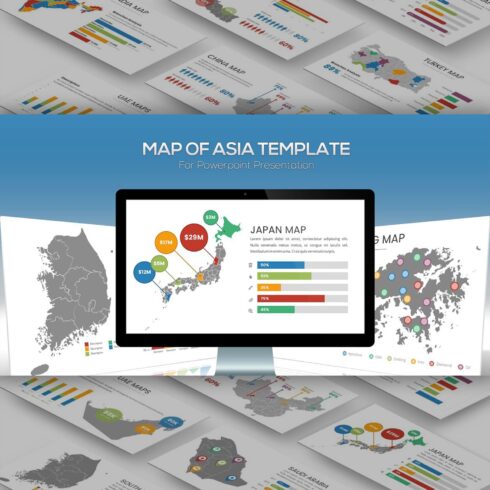
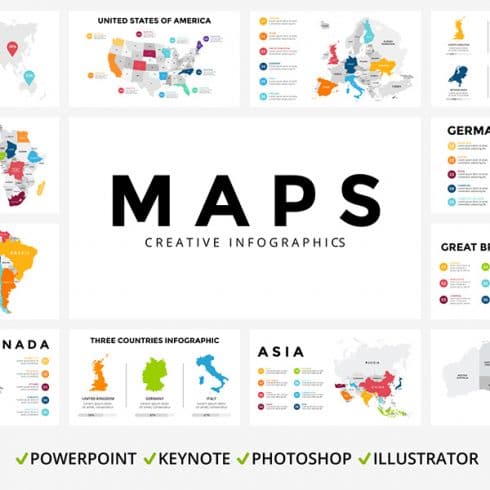
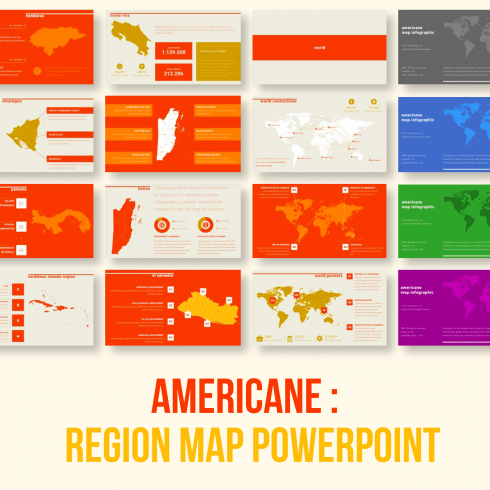
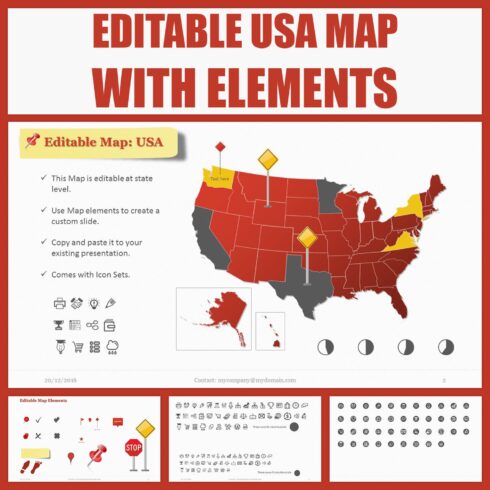
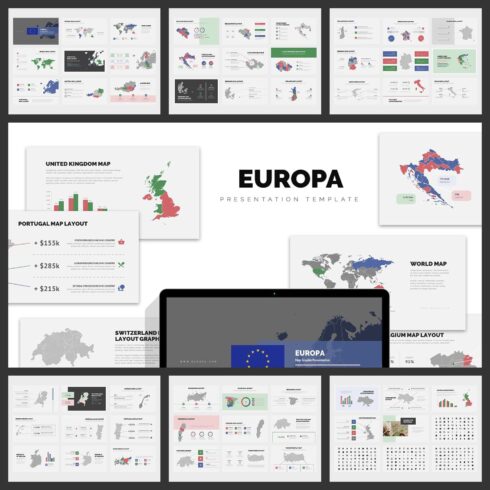
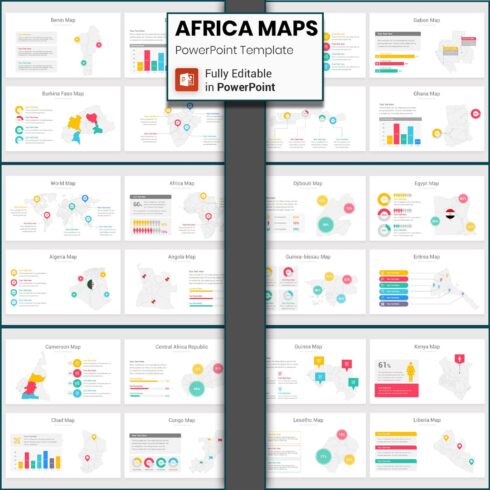
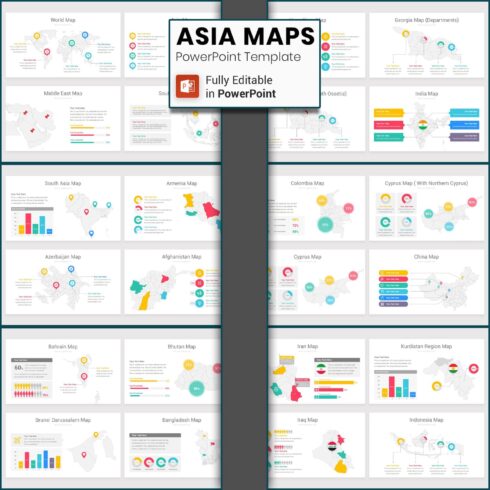
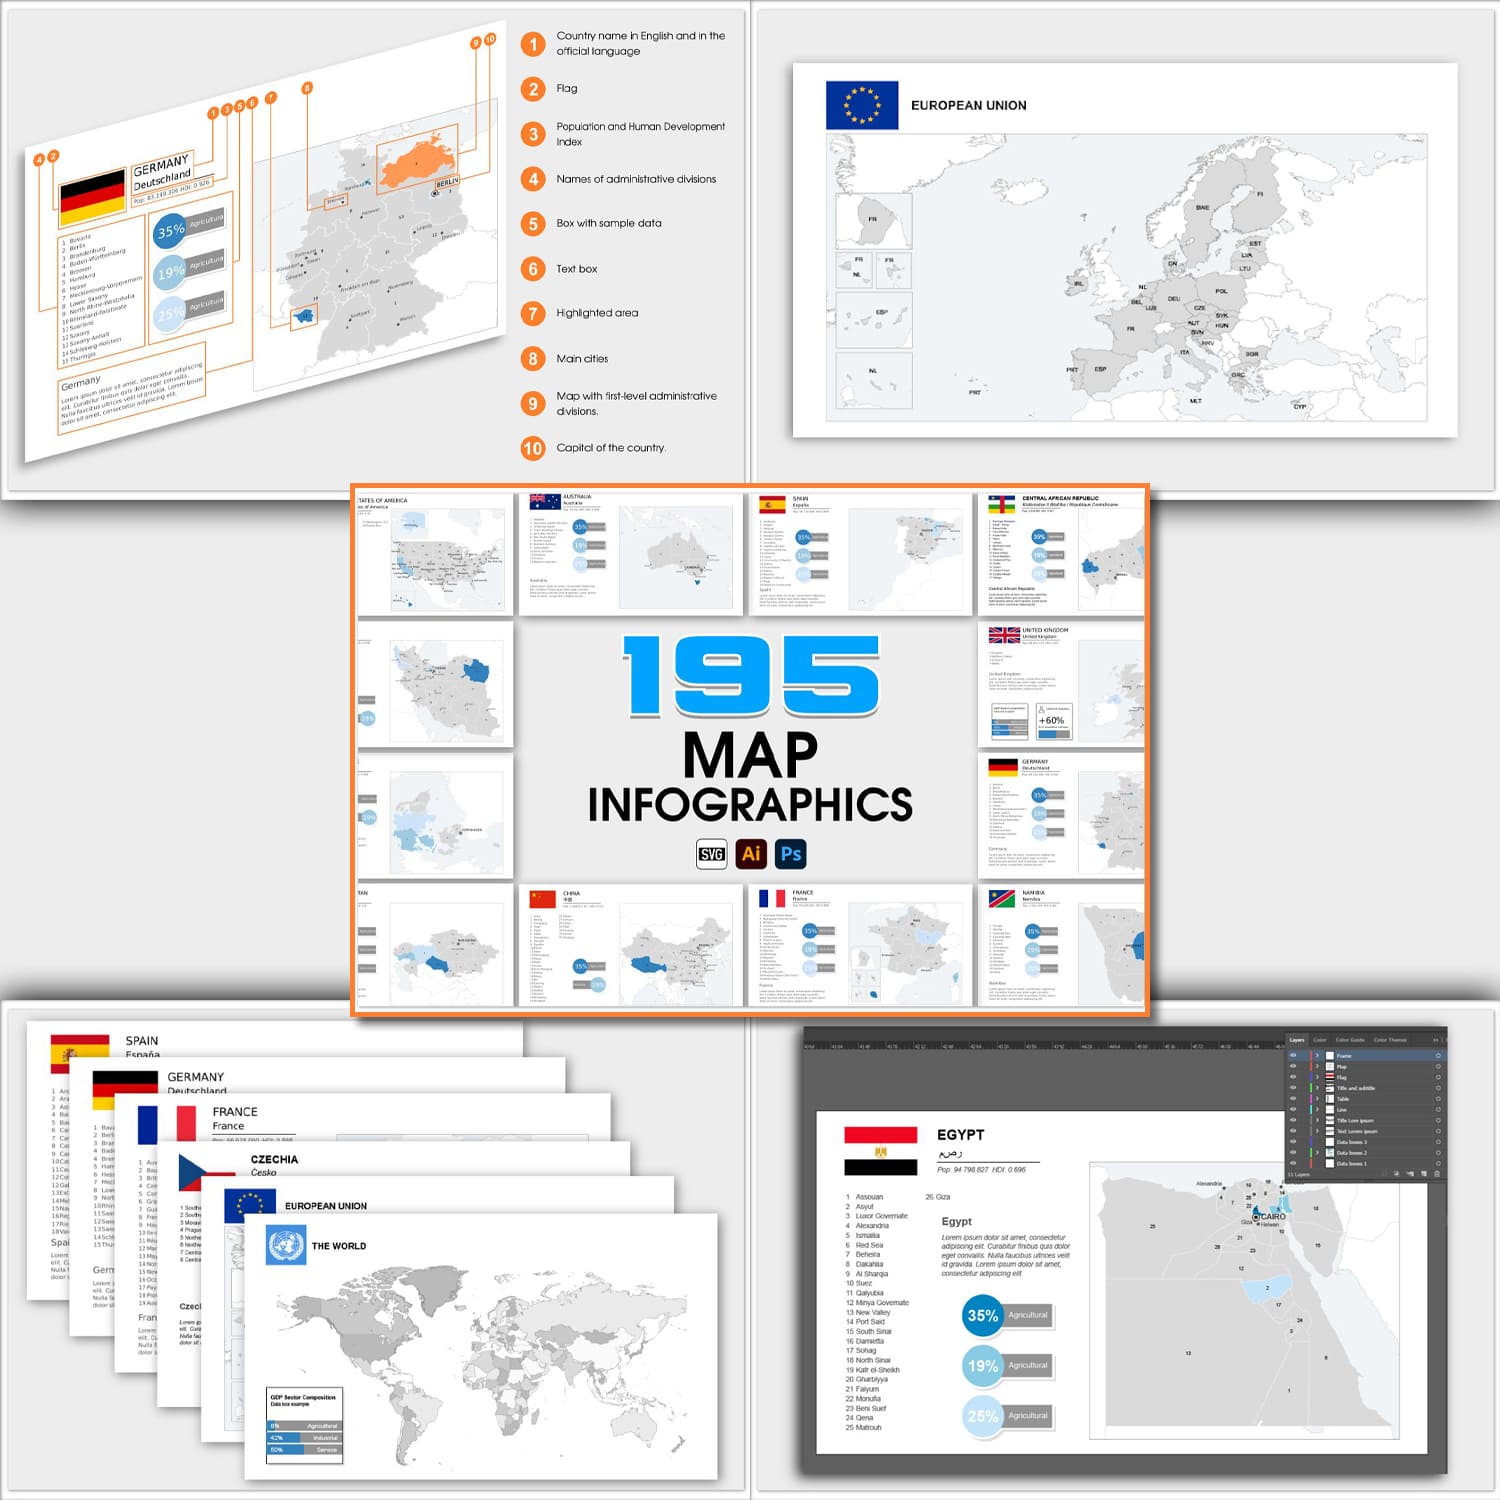
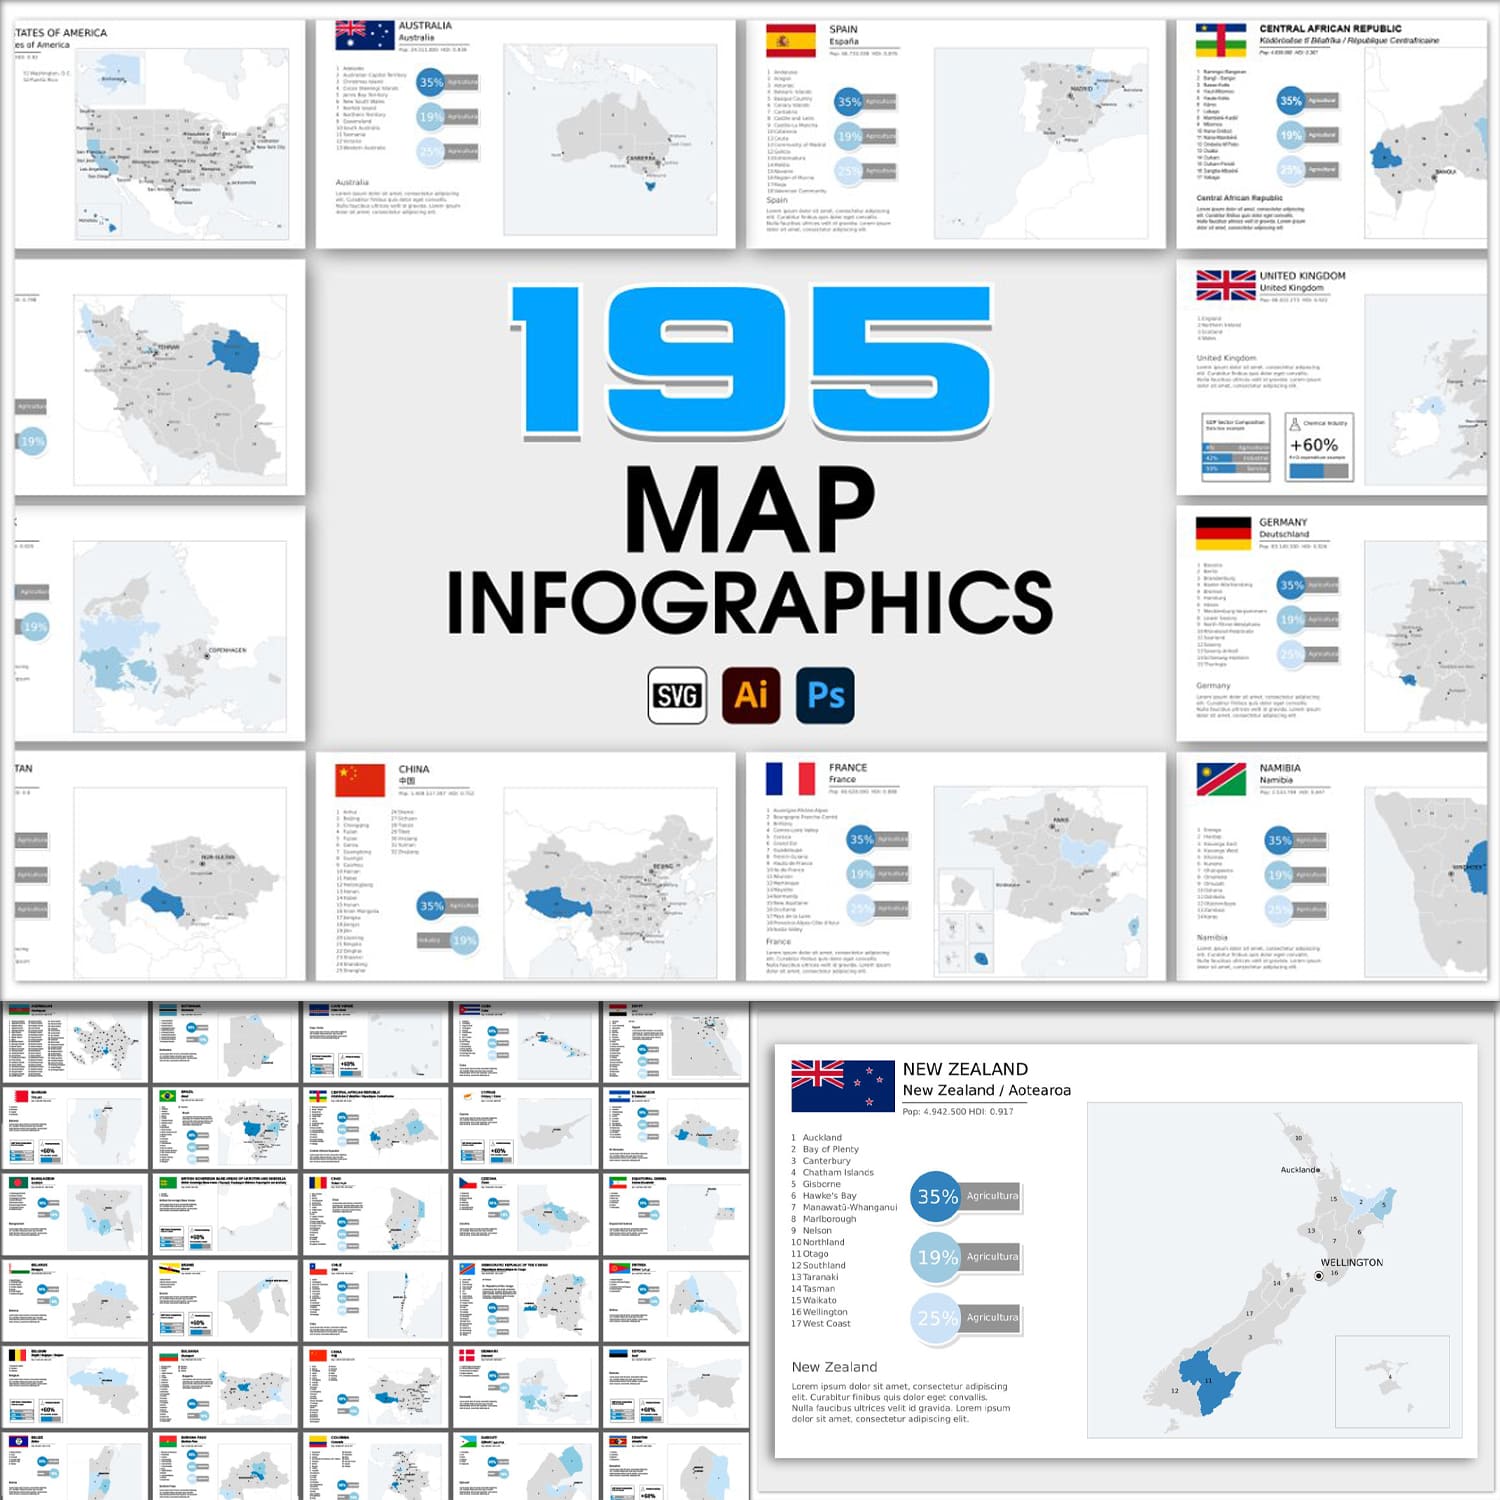
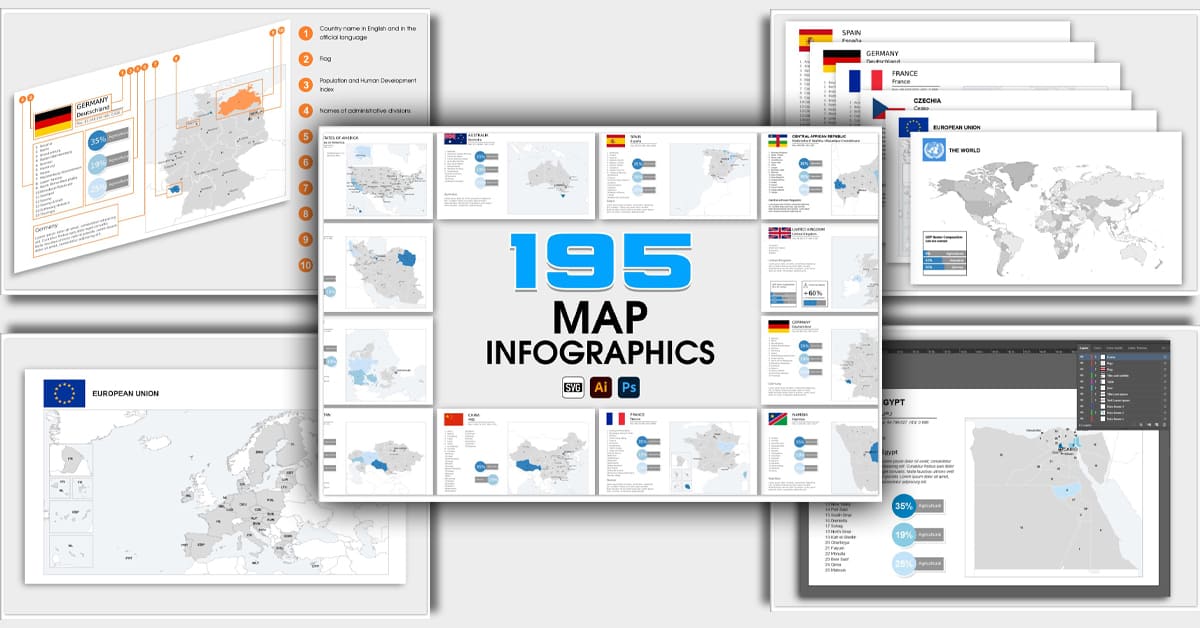
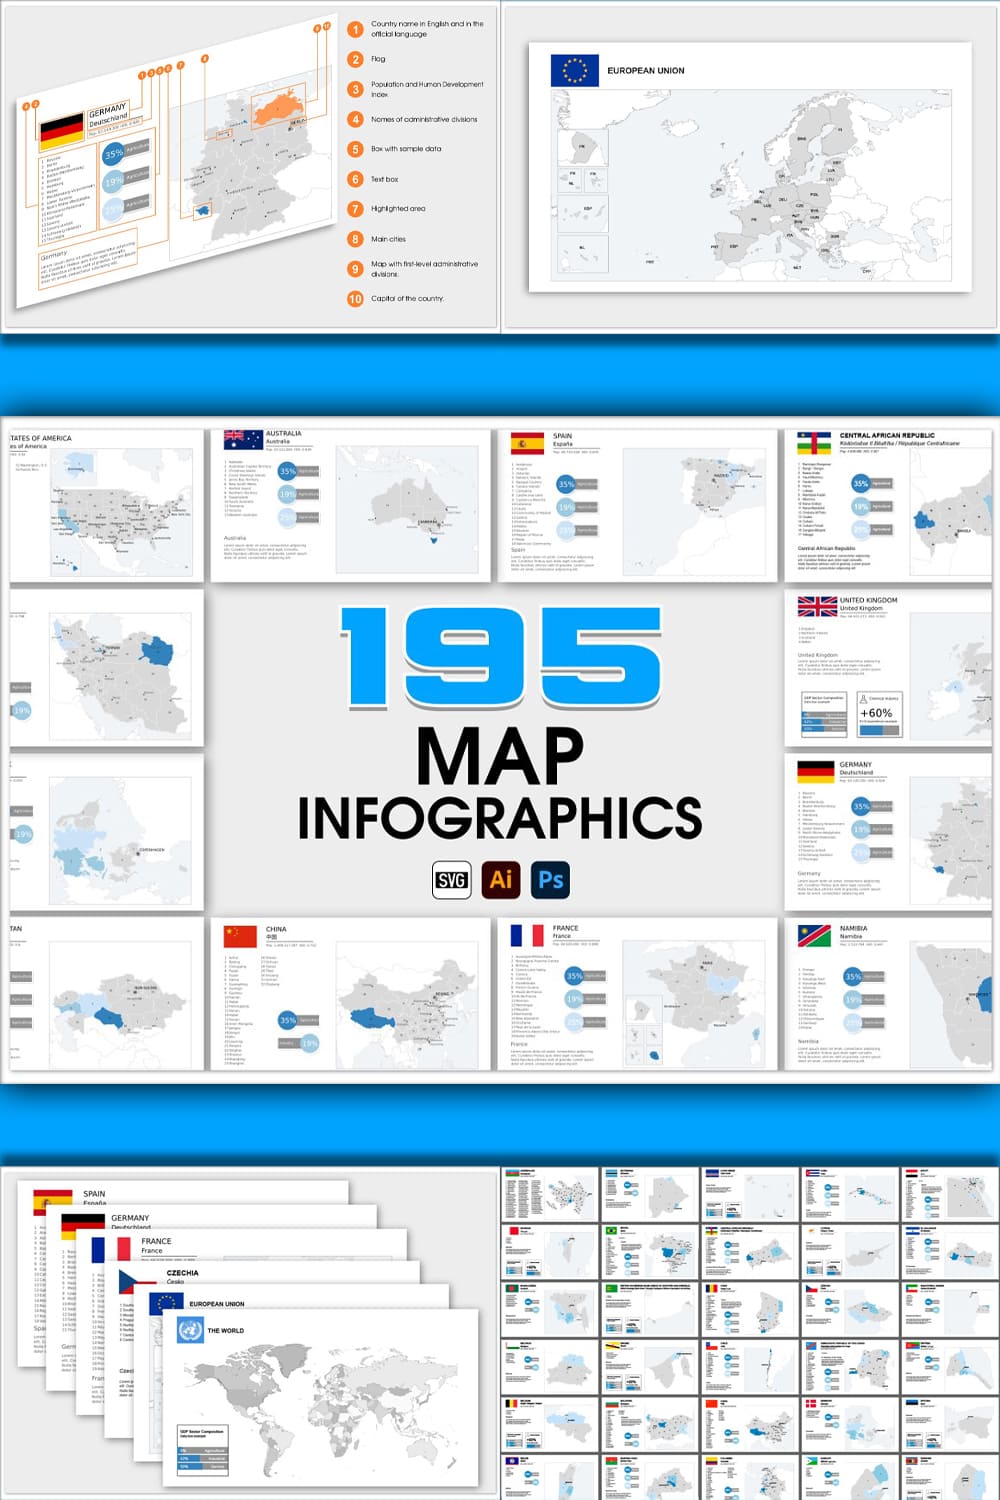
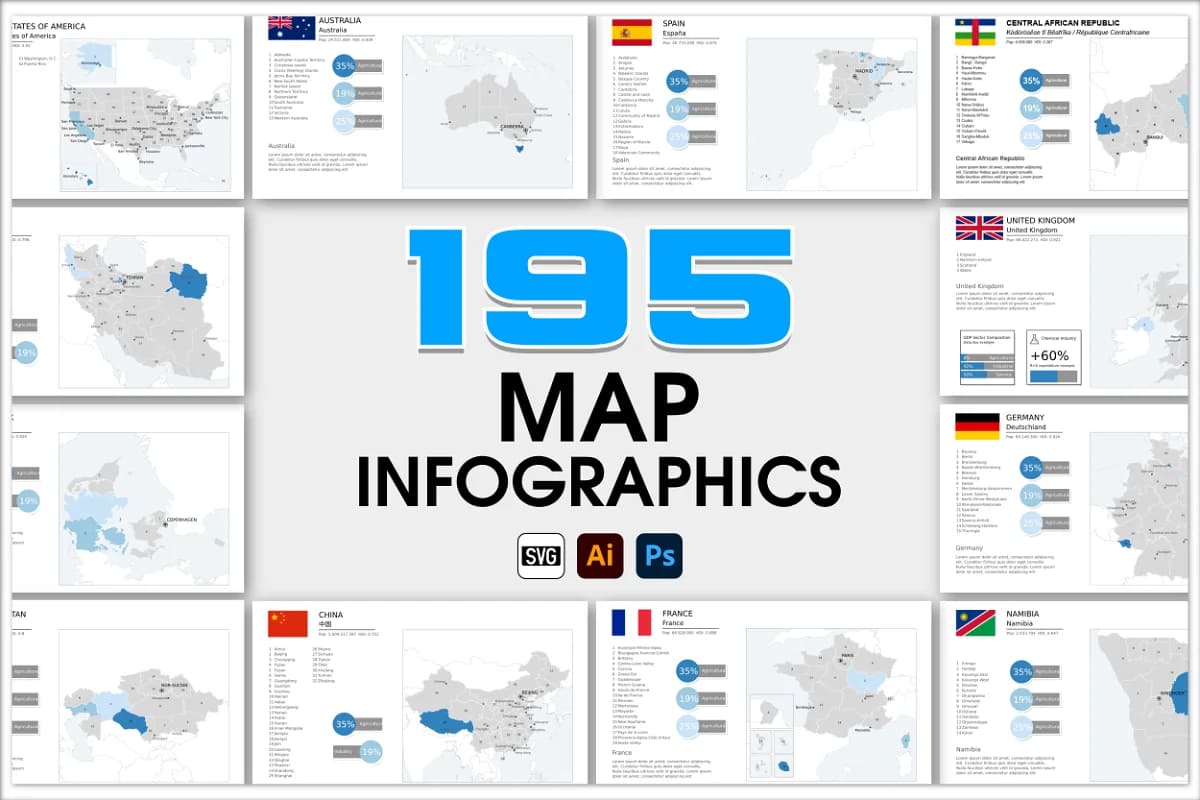
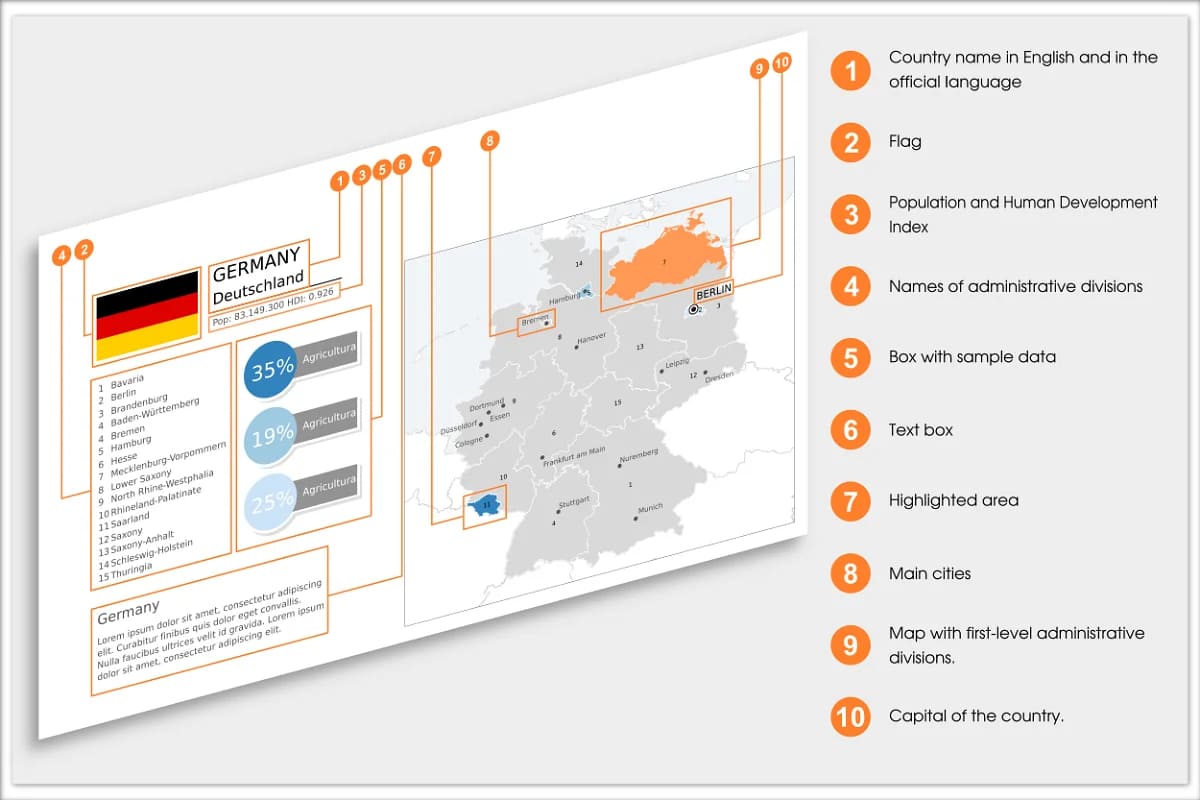
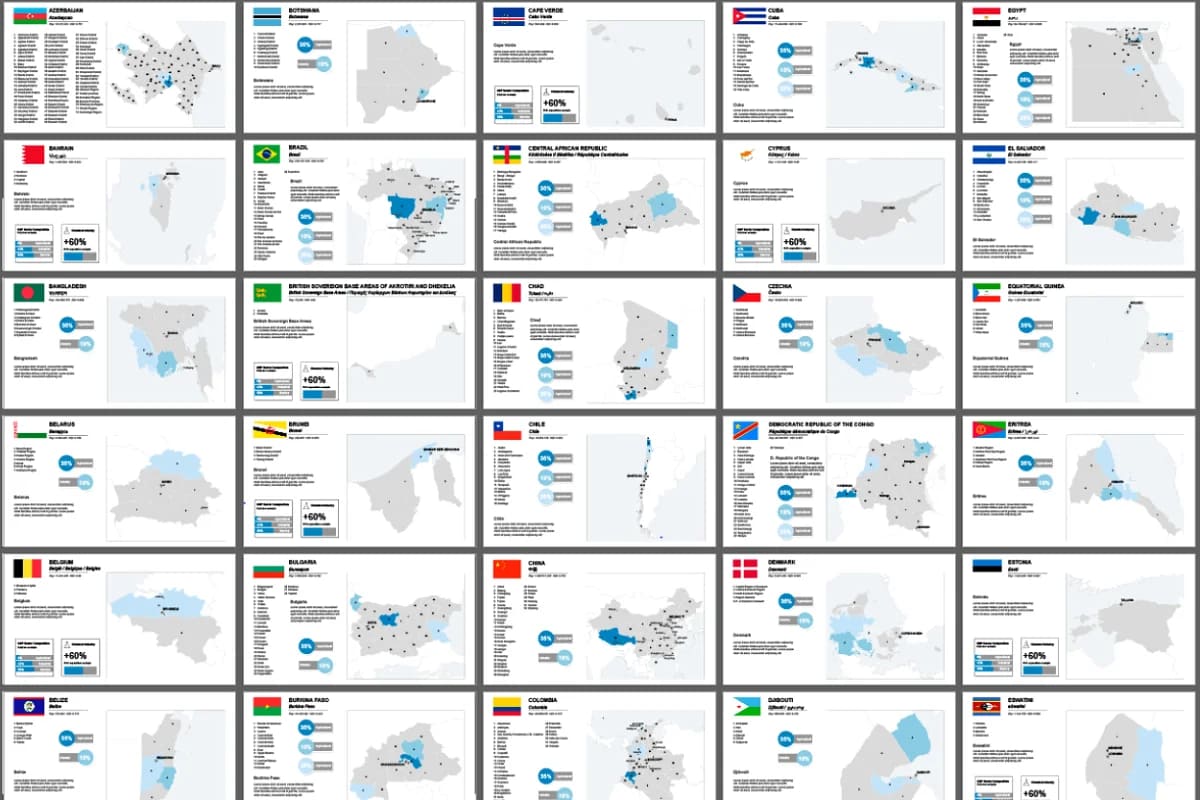
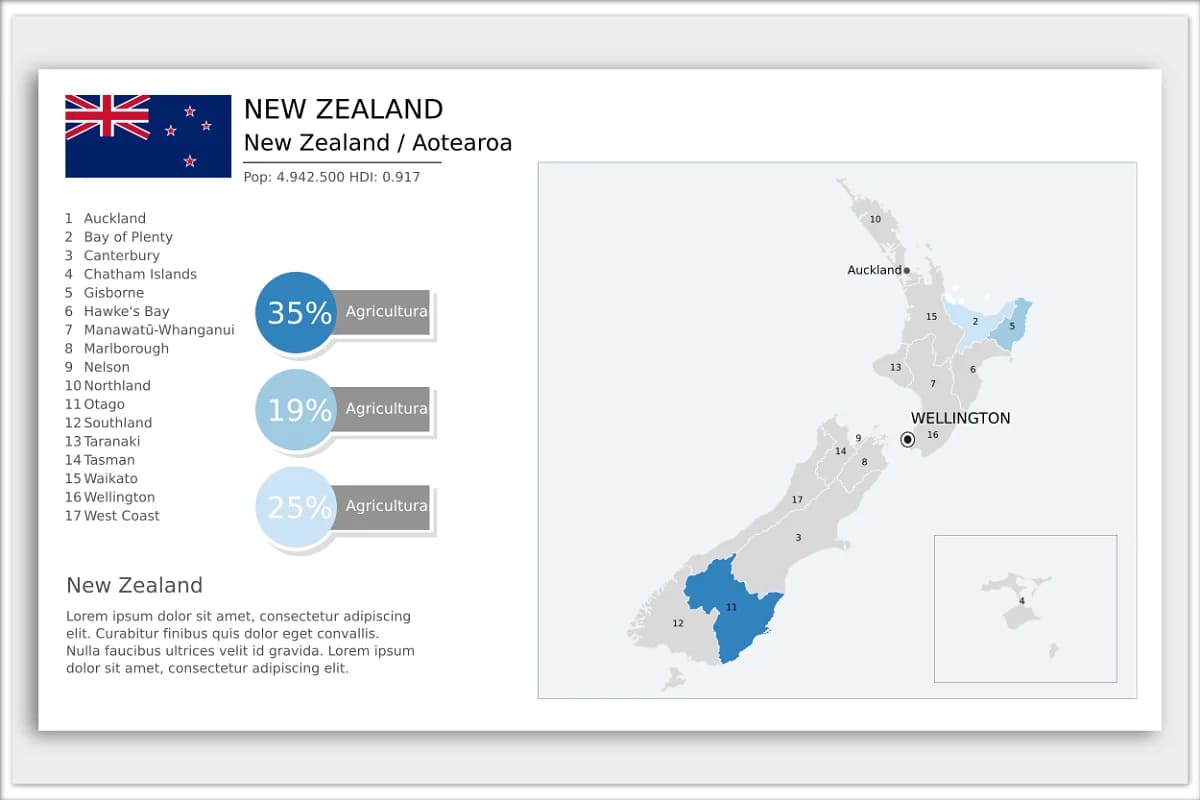
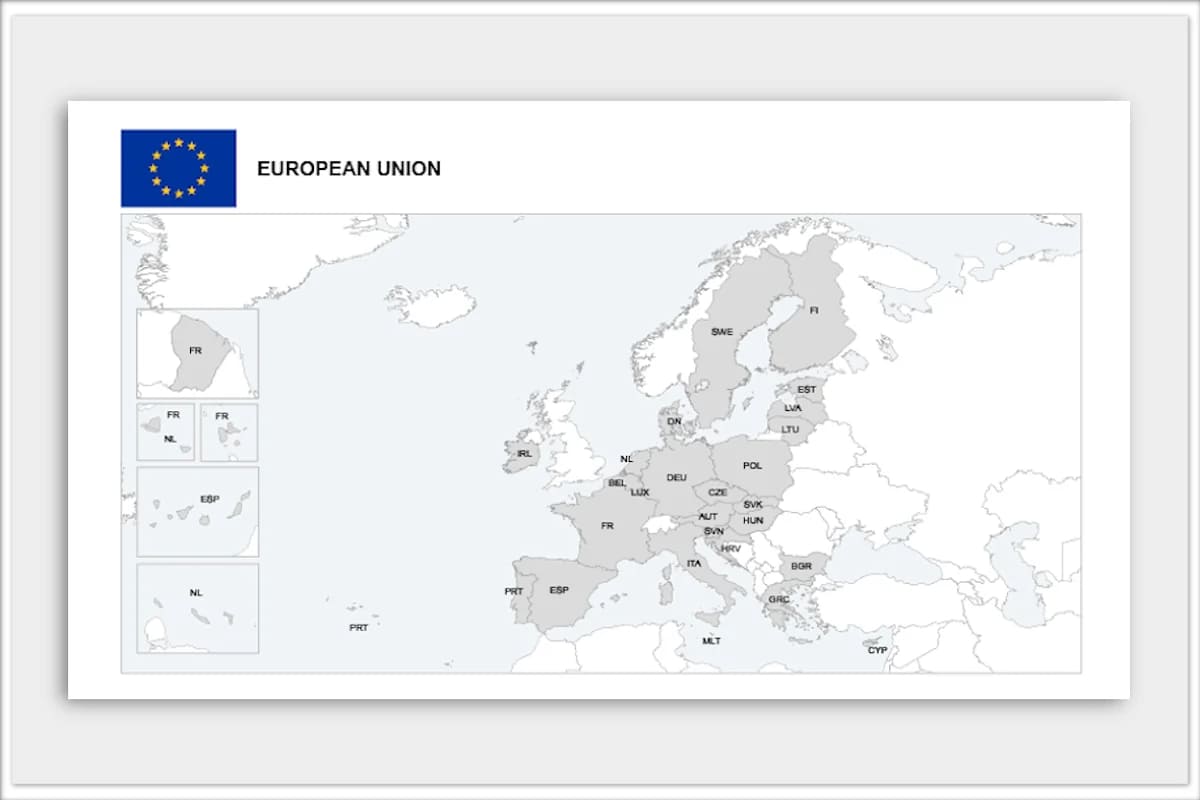
195 Map Infographics. This product includes 195 Map Infographics specially designed for business presentations, work journalistic, educational or multimedia projects.
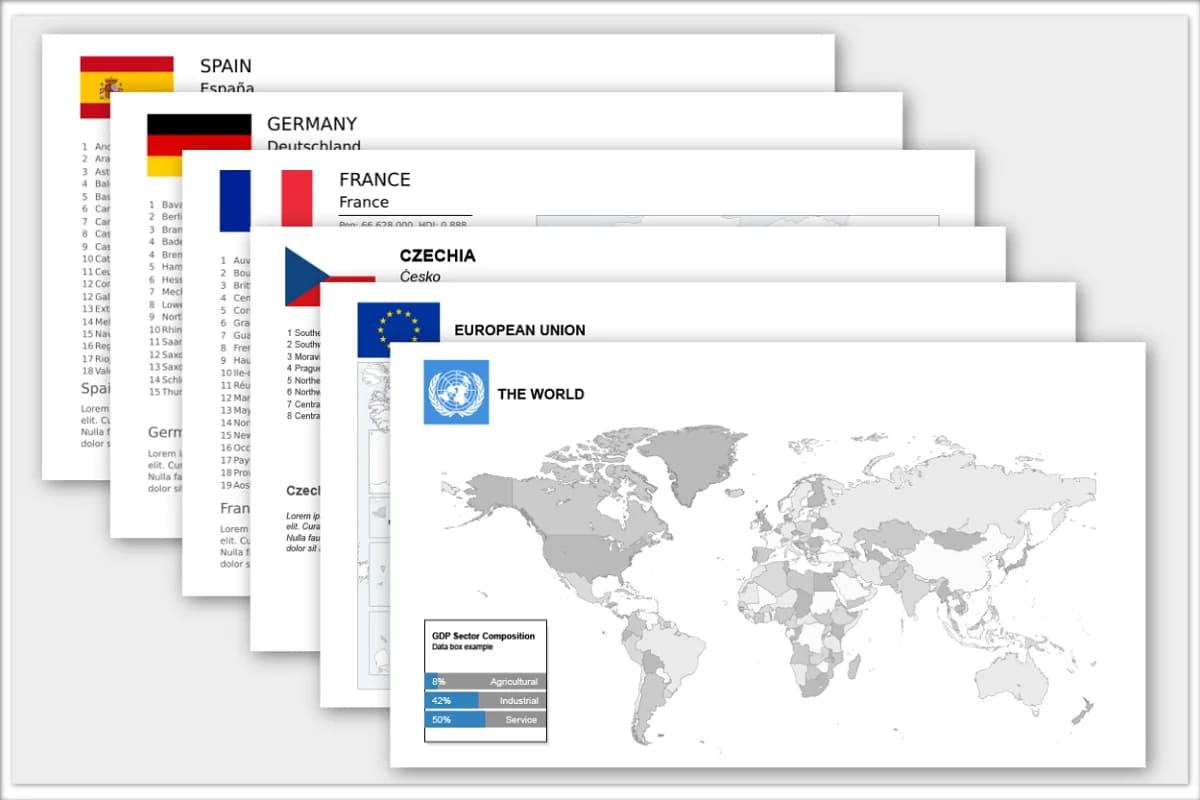
The infographics show essential data of ALL countries of the world, as well as a list with the names of the first level administrative divisions such as states, provinces, governorate, districts, etc. In addiction, the maps have the largest cities of each country. Ideal to add to your slides or publications and provide a professional and quality value to your work. The bundle includes a political map of the world organized in layers: each layer shows a country that you can hide or show.
Add these maps to your slides in Microsoft PowerPoint, Keynotes or Google Slides and make your presentations professional and easy to understand.
Main features:
Notes
Before purchasing you can download a sample file from here: https://drive.google.com/file/d/124yBqCGEBKH7mpEaoQy0LfZjXfztpfXK/view?usp=sharing