First Day School Sign, Last Day Board (Canva Editable)
$4
| Created by | VECTORMASTOR |
|---|---|
| File type | AI, EPS |
| File size | 5.76 MB |
| Date of Creation | March 10 2023 |
| Color | blue pink yellow |
| Rating | 5 (13) |
| Category |
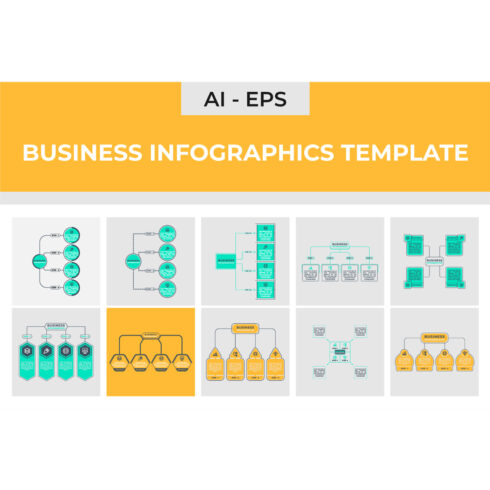
Timeline of your business: Create a timeline of your business from its inception to the present day, highlighting key milestones and achievements.
Process flow chart: If your business has a complex process, create a flow chart that breaks it down into simple steps. This could be useful for demonstrating your expertise and efficiency.
Product or service comparison: Create an infographic that compares your product or service to your competitors. Use statistics and visuals to highlight your unique selling points.
Customer demographics: Use data to create an infographic that visualizes your customer demographics. This could include age, gender, location, income, and other relevant factors.
Industry trends: Create an infographic that illustrates the latest trends and developments in your industry. This could be useful for establishing your business as a thought leader.
Company culture: Use visuals and statistics to showcase your company culture. This could include things like employee satisfaction, community involvement, and environmental responsibility.
Financial data: Create an infographic that breaks down your financial data, including revenue, expenses, and profits. Use visuals to make the information easy to understand.
Brand identity: Use visuals to showcase your brand identity, including your logo, color scheme, and messaging. This could be useful for building brand awareness and recognition.
Testimonials and case studies: Use customer testimonials and case studies to create an infographic that showcases your expertise and success.
Social media statistics: Create an infographic that showcases your social media presence and engagement. This could include follower count, likes, shares, and comments.