Luxury Islamic Geometric Floral Seamless Pattern | Premium Vector Textile & Surface Design
$8


| Created by | JsFo |
|---|---|
| File type | PPT, PPTM, PPTX, ZIP |
| File size | 30.41 MB |
| Date of Creation | June 12 2024 |
| Color | blue green purple red |
| Rating | 5 (12) |
| Category |
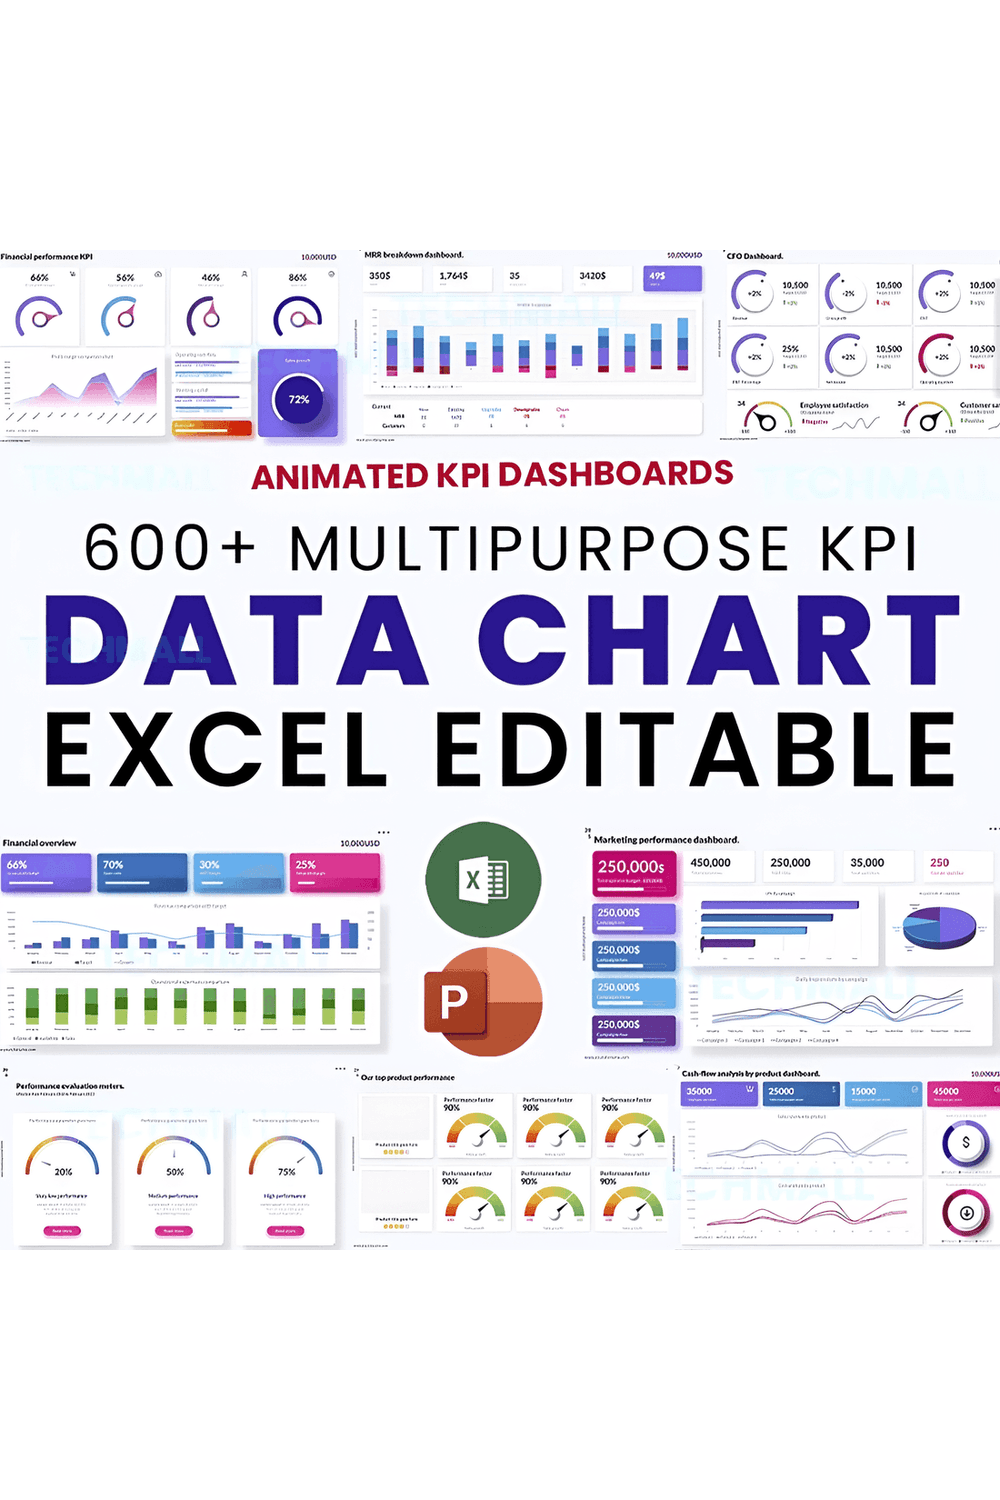
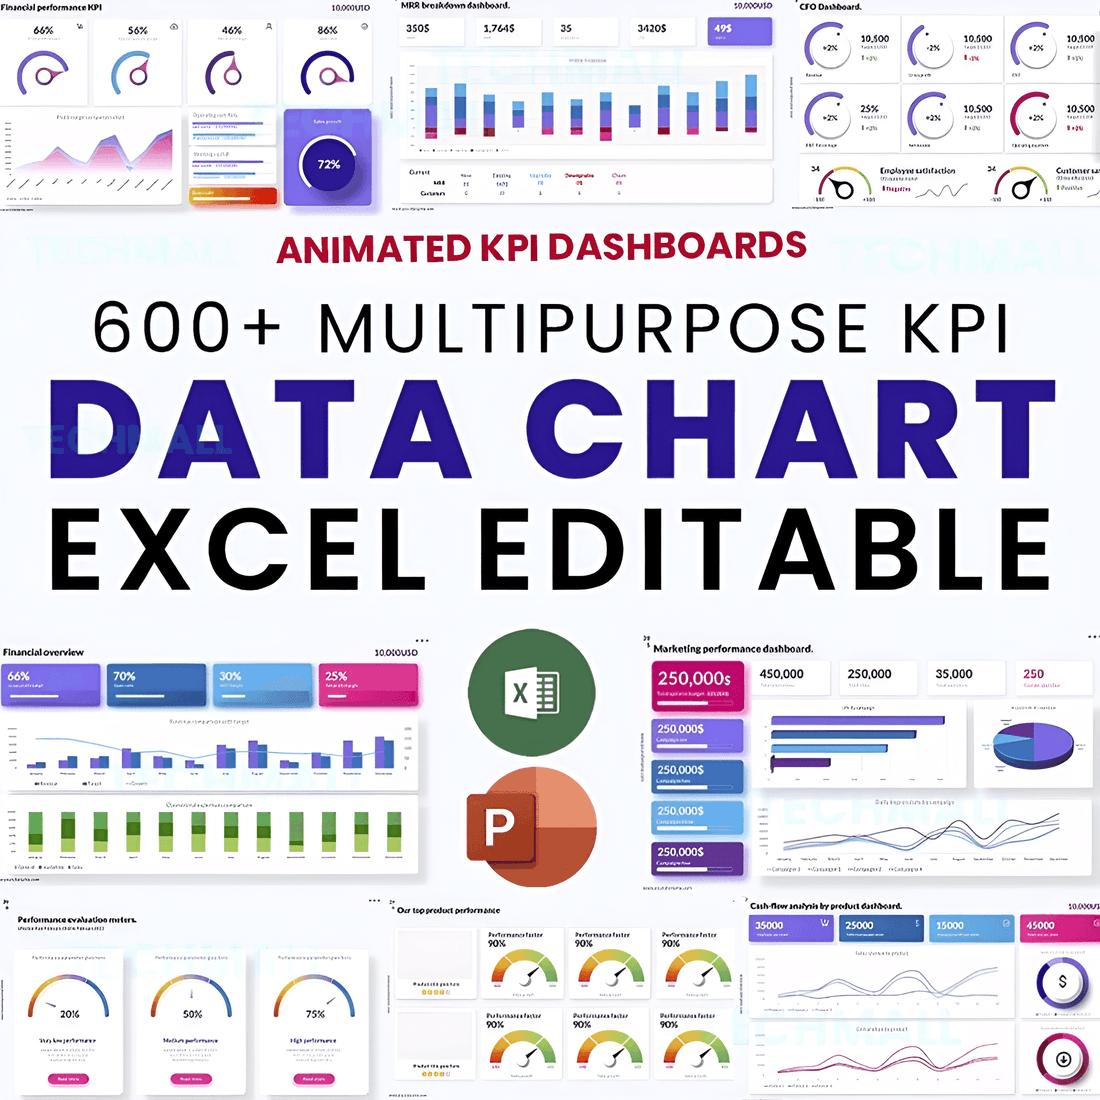
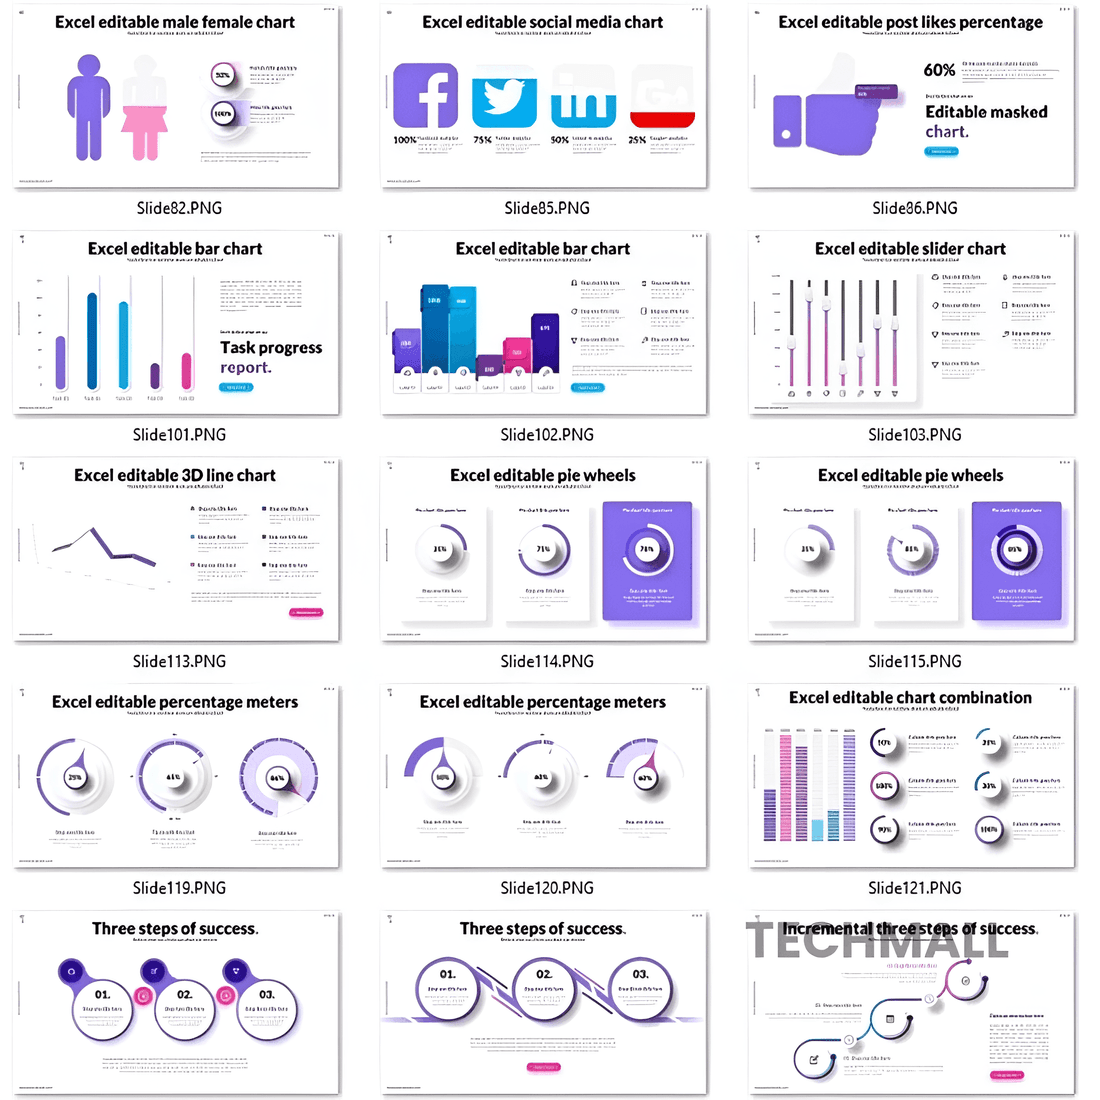
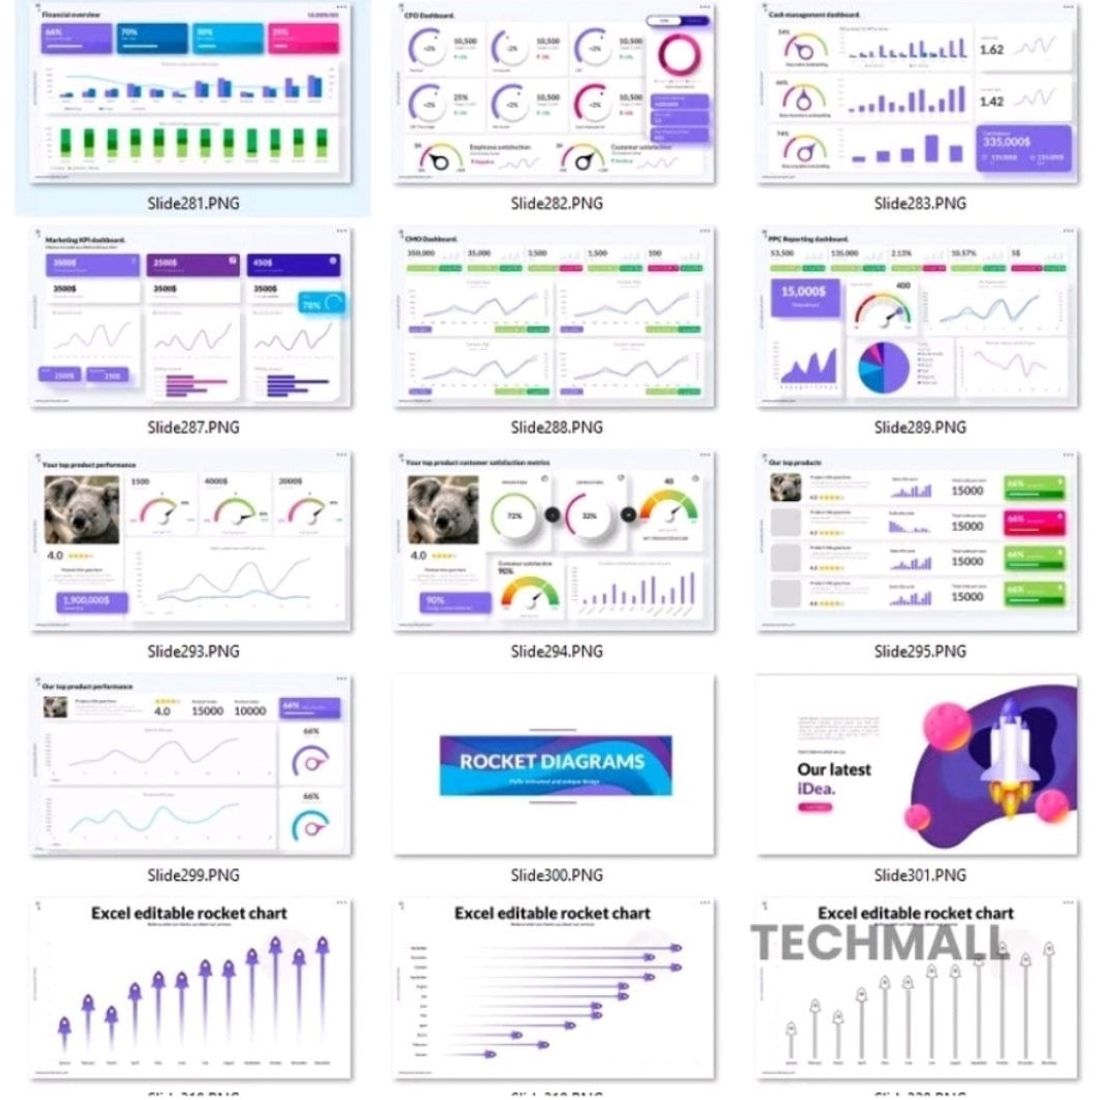
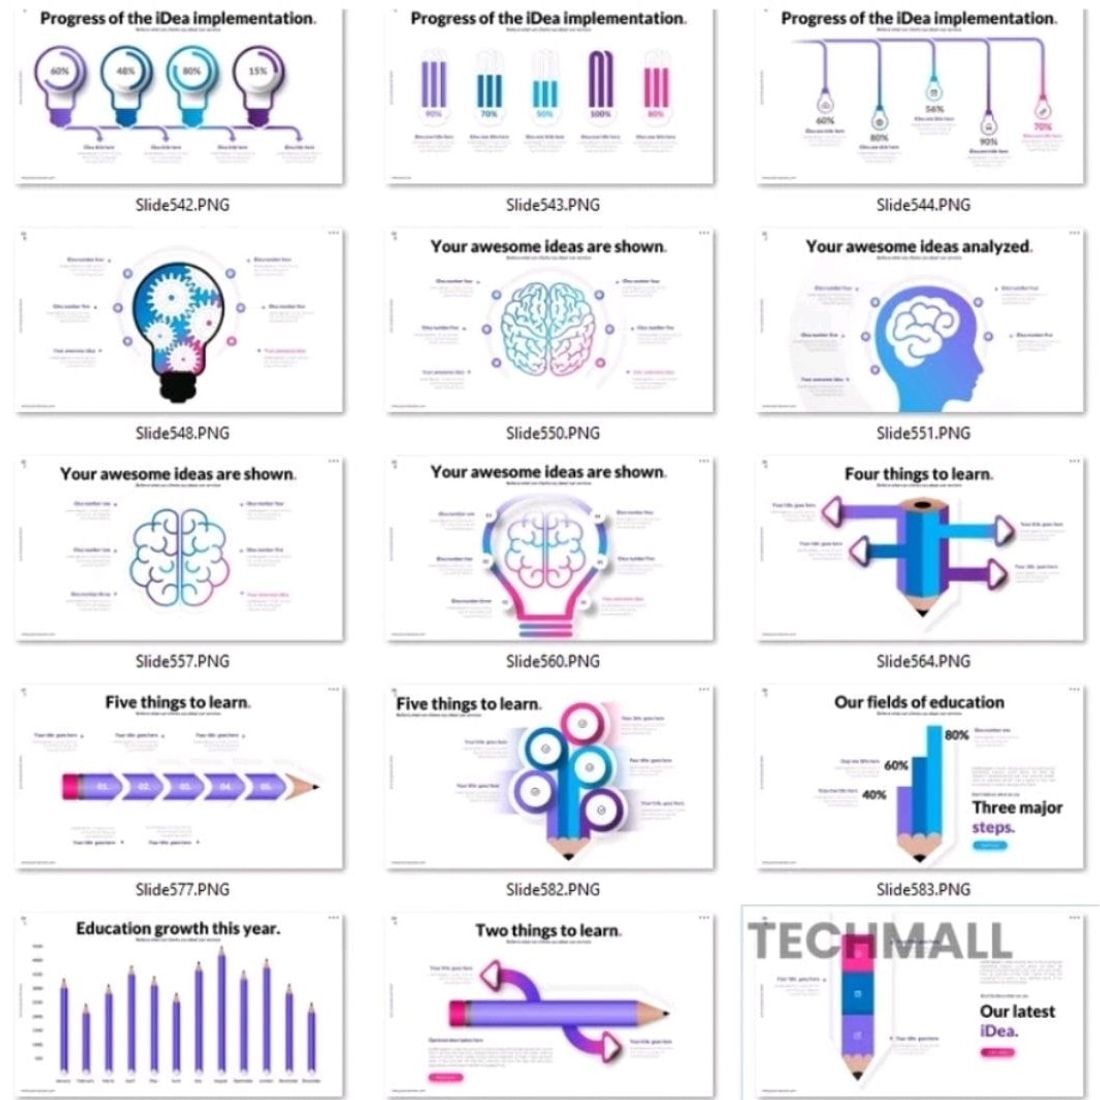
Dear creators, storytelling with data has never been easier! We are proud to introduce the “600+ Sides Multipurpose KPI Data Charts Presentation Template – Excel Editable”.
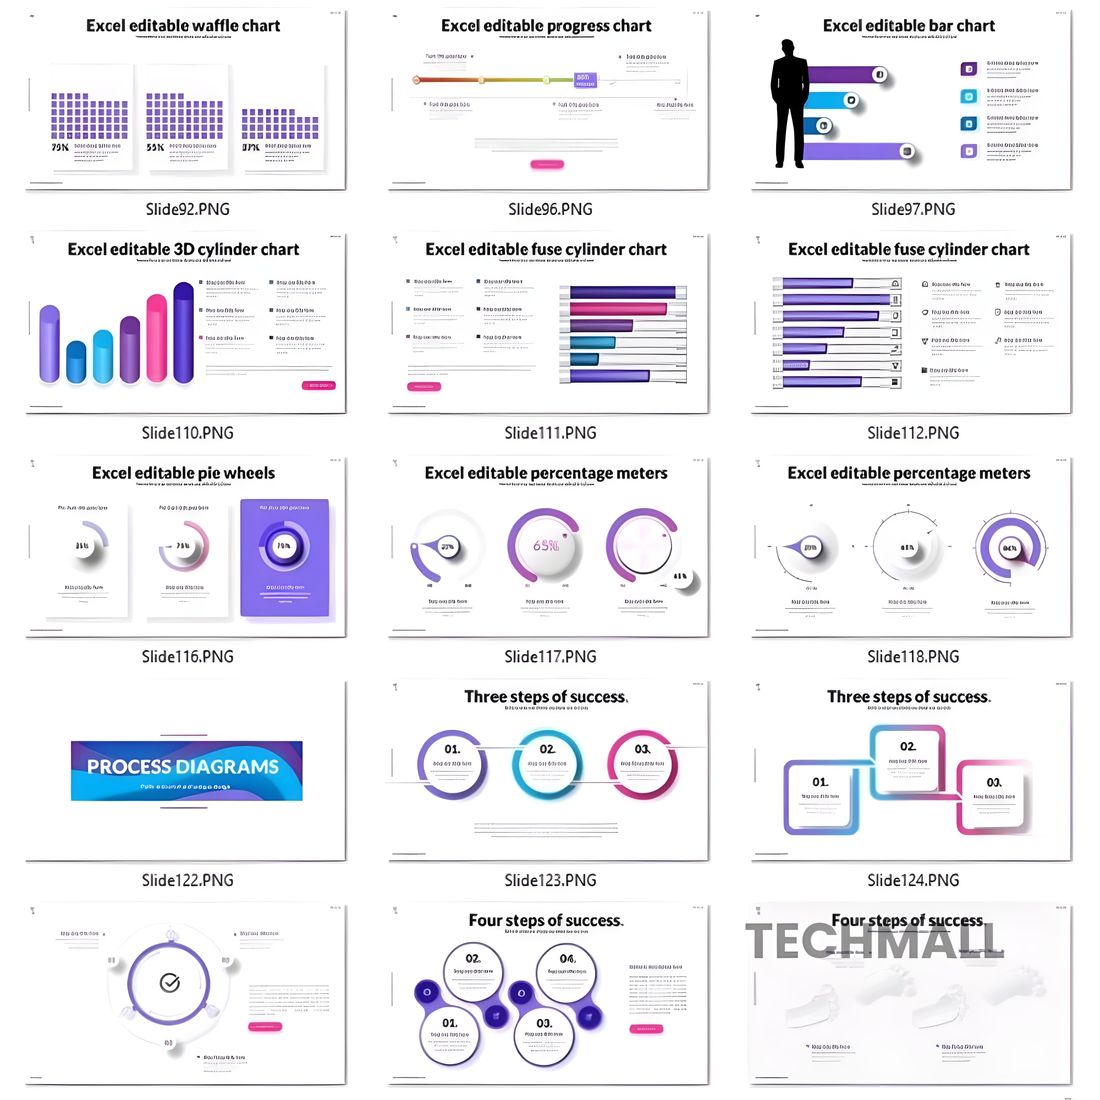
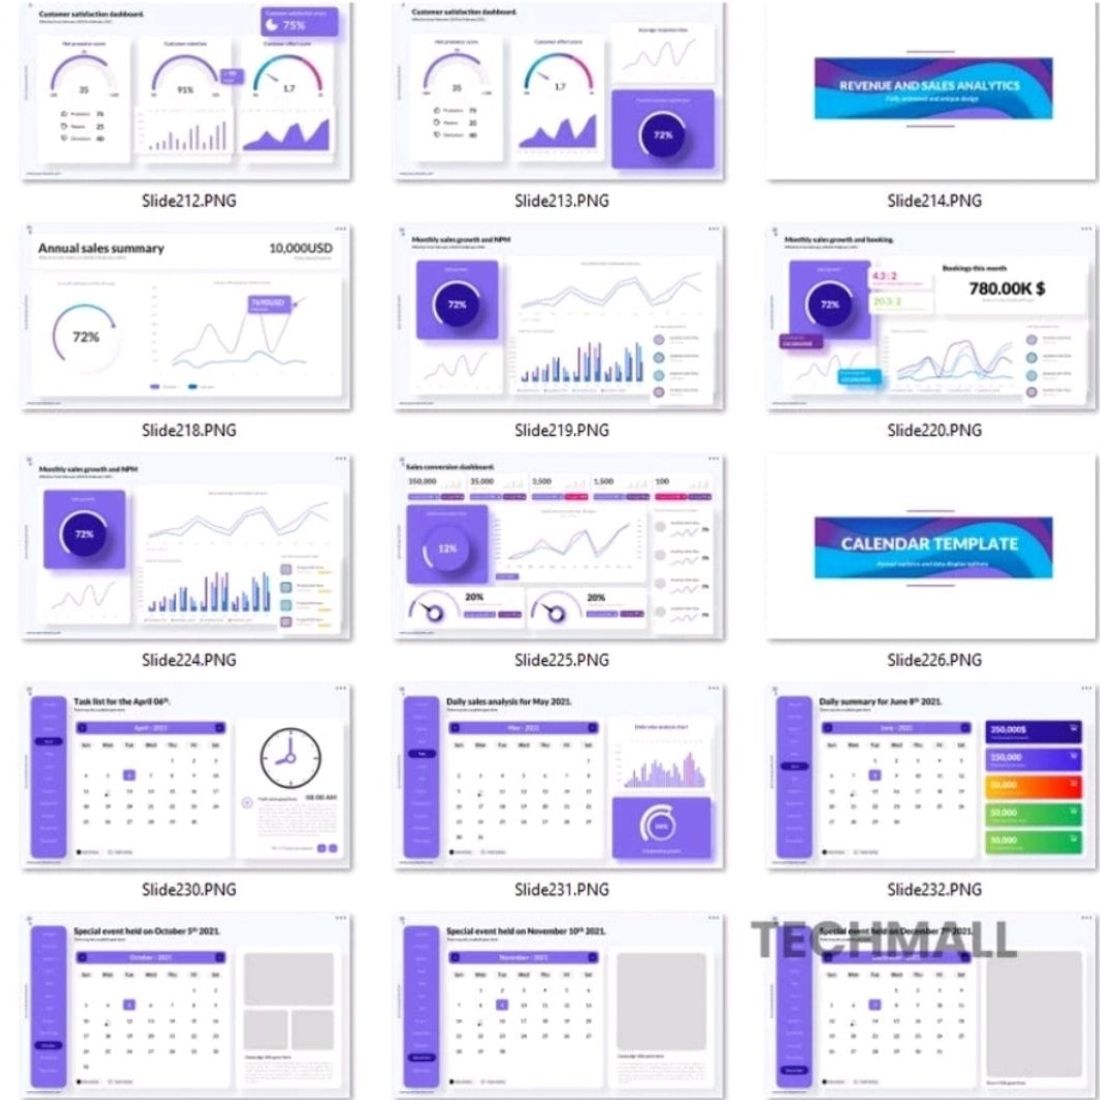
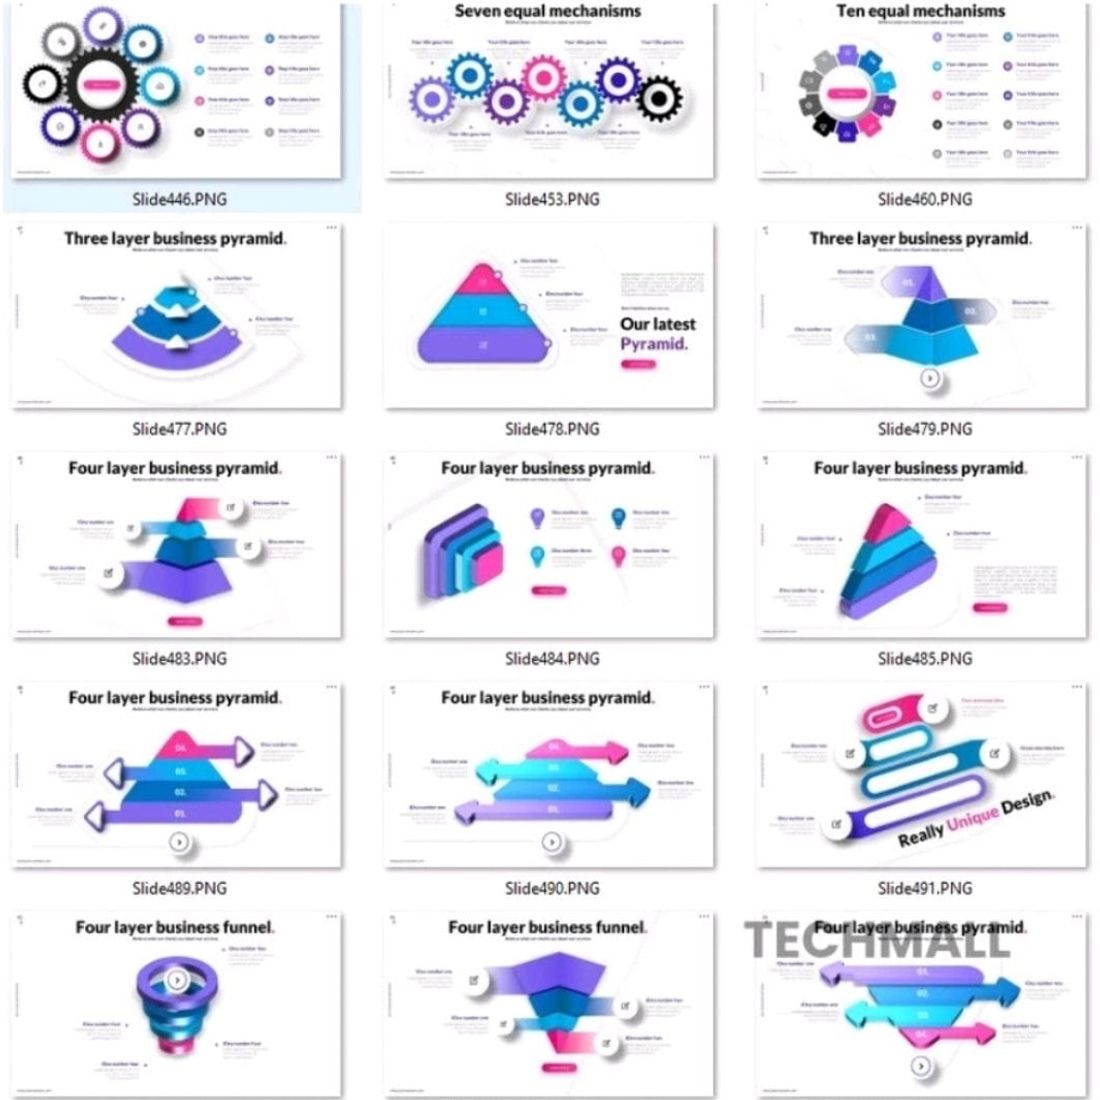
This multipurpose PowerPoint template will unleash endless possibilities for presenting your data. Whether you are an entrepreneur, analyst, educator, or other professional, this template will be your powerful assistant. With over 600 chart style options to choose from, you can easily showcase key performance indicators (KPIs), financial data, statistics, and various data trends.
What makes this template unique is its Excel editing functionality. You can directly input data into Excel, and all charts will automatically update, saving you the hassle of manual entry. Simple, efficient, and stylish. It perfectly fits any type of presentation you need to create.
1. Over 600 chart styles covering popular types like bar charts, line charts, pie charts, matrix charts, and more
2. Fully editable and customizable Excel worksheets
3. Fashionable and modern design to give your presentations a fresh new look
4. Suitable for various industries and topics to meet all your needs
5. Time-saving and efficiency-boosting
Unleash the charm of your data stories now! Click to order and make your presentations stand out from the crowd.